Enhancing GUI for Real-Time Data Display and Database Integration
This project focuses on improving a previously designed GUI by adding essential functionalities such as real-time data interaction with a database, displaying time of arrival (TOA) for packets, and allowing manual threshold setting for data analysis. Key modifications include database integration in the 'GuiMain', 'RSSIDATA', and 'DISPLAY' classes, facilitating data retrieval and visualization. The implementation supports user-defined thresholds to enhance system performance and provide insights into environmental changes. This comprehensive approach improves speed, reliability, and user experience.

Enhancing GUI for Real-Time Data Display and Database Integration
E N D
Presentation Transcript
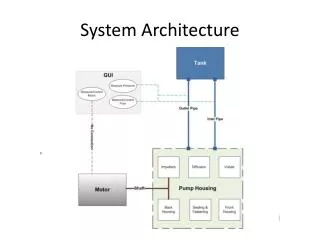
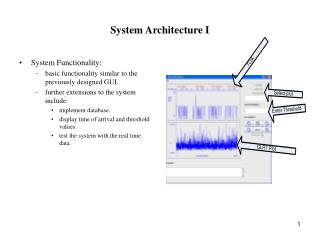
System Architecture I • System Functionality: • basic functionality similar to the previously designed GUI. • further extensions to the system include: • implement database. • display time of arrival and threshold values. • test the system with the real time data.
Class based structure of GUI Client: Summary of modifications implemented in the previously designed classes: ‘GuiMain’: It is modified to obtain the data from the server and write it to and read it from a database. ‘NodeDetailThread’: This class now contains methods to interact with the modified ‘RSSIDATA’ and ‘Display’ classes and display the received threshold values relative to the threshold set by the user. ‘RSSIDATA’: It has been modified to write data to a database and read data from the database. ‘DISPLAY’: This class has been modified to display time of arrival for each packet. It also displays the threshold variation in the received data packets. System Architecture II
System implementation details: Modified packet structure extended field structure of the packet: TOA (Hr) TOA (Min) TOA (Sec) TOA (mSec) TOA (AM/PM) displayed time format: hours:min:sec:millisec:Meridian(AM/PM) System Architecture III
System Architecture IV • System implementation details: • database implementation.
System Architecture V • commands used for communication between MySQL server and client program: • load appropriate driver • Class.forName("com.mysql.jdbc.Driver"); • retreive data from database • stmt.executeUpdate(query); • table implemented in database:
System Architecture VI • displaying GLRT values: • select the radio button on the interface • enter the threshold manually • press the display button • the user interface plots the GLRT values with respect to the threshold set by the user • displaying TOA values: • TOA is displayed automatically when the packets are being displayed.
starting database: stopping database: Tests and Results I
stopping database: GUI launch window: Tests and Results II
secondary launch window: this figure displays: time of arrival of packets based on server time. Time of arrival is an approximation in order of milliseconds. Tests and Results III
the analysis window: this window displays the real time obtained data. the data displayed corresponds to the data collected for a period of 45 minutes. Tests and Results IV
analysis window: this window displays: the GLRT values. the user is able to set the threshold manually. test the obtained GLRT values with different threshold levels. this helps to calibrate the system and improve the perfomance of the system Tests and Results V
analysis window: Tests and Results V
Conclusion • In this 4 –week project we have successfully : • implemented database into the GUI client. • tested the system with the data obtained from the ITU. • display the time of arrival of packets. • display GLRT data with respect to the threshold set by the user. • As a result of implementation of above mentioned specifications the perfomance of the system has increased in terms of speed • Furthermore the user can now perfome some basic detection based on the threshold values and determine the time of occurence of change in environment.