Download
1 / 38
380 likes | 561 Views
General Circulation Modelling on Triton and Pluto. F. Forget (N. Descamps) LMD, ISPL Paris. General Circulation Models GCMs Global Climate models Designed to “completely’ simulate a terrestrial planet environment.

E N D
General Circulation Modelling on Triton and Pluto F. Forget (N. Descamps) LMD, ISPL Paris
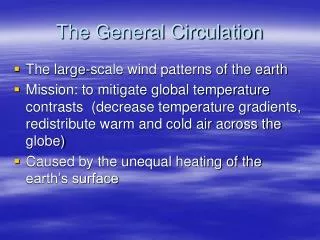
General Circulation Models GCMs Global Climate modelsDesigned to “completely’ simulate a terrestrial planet environment • Used on Earthfor all climate science (weather forecast, data assimilation & climatology, chemistry, plaeoclimate, climate change, biosphere studies) • Mars : idem • Titan : idem • Venus : under developement • Triton • Pluto
Triton and Pluto: very thin atmospheres • Triton : ~1.4 Pa , mostly N2, with some CH4 (in 1989) 2-4 or 6 Pa today ? • Pluto : 1-5 Pa , N2, with a little CO, Ar, CH4… • The pressure is high enough to fully compute the dynamic with the primitive equation of meteorology (GCM thermosphere are used up to 10-8 Pa) • BUT :Specific processes related to the direct condensation/sublimation of a large part of the atmosphere
Turbulent Mixing in the planetary boundary layer • On Pluto and Triton: effect of surface condensation & sublimation • We use Turbulent closure scheme based on Mellor and Yamada 2.5 parameterisation : specially adapted to stable atmosphere (Forget et al. 1999) + numerical algorithm to compute the condensation/sublimation effect (Forget et al. 1998) Condensation Sublimation Bare Ground
Surface condensation of N2 • Near Surface enrichment of other gases • The near surface composition can strongly enriched with less volatile species (Ar ?) • Affect near surface condensation temperature • Density Induced convection • Affect fluid dynamics, etc… • Very « alien » meteorology !
4 3 2 1 • Numerical algorithm adapted from Mars (Forget et al. 2006, Granada abstracts)
MARS : Detection of Argon enrichment due to CO2 condensationby Mars Oddyssey Gamma Ray Spectrometer(GRS)(mean Ar mixing ratio in 75°S-90°S) Sprague et al. 2004
Formation of “Spider” in the “criptic” region(Piqueux et al. 2003Kieffer et al. 2006)
Formation of “Spider” in the “criptic” region(Piqueux et al. 2003)
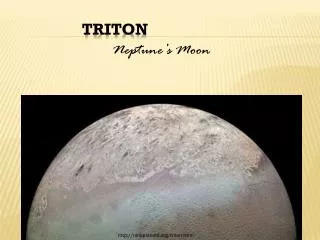
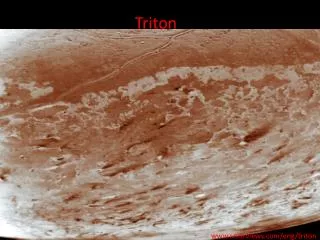
TRITON ATMOSPHERE • Some things we know about Triton in 1989 • Surface dark streaks direction : eastward surface wind in the southern hemisphere • Geyser like Plumes • Westward wing at ~8 km in the southern hemisphere • Tropopause around ~8 km • What we don’t know well: • Surface frost distribution (N2, CO, CH4, …)
Triton General Circulation Model • 1) Hydrodynamical code • to compute large scale atmospheric motions and transport • Grid point model • Horizontal resolution : ~200 km (32x24) • 15 vertical layers (5m, 20m, … 50 km) • 2) Physical parameterizations • to force the dynamic • to compute the details of the local climate Flux from thermosphere T(z) Thermal conduction Atm N2 condensation Convection Turbulence Surface N2 condensation Internal heat flux Subsurface conduction (13 layers)
Triton free atmosphere processes : hypothesis • No radiative transfer below 40 km (Yelle et al. • Conduction : Temperature below 40 km insensitive to thermosphere variations (400 km) • Constant flux from thermosphere Example of temperature profiles Amplitude of temperature variations 400 km 60 km 40 km Tmean Tmin Tmax Period = 1 triton day Diurnal cycle Period = 15 Earth years
Case # 1 Triton totally covered by CO2 frost • Flux top = 1.15 10-6 W m-2 • Ice emissivity = 0.6 • Thermal inertia = 293 SI • Flux géothermique = 0.06 W m-2 • Albedo : 0.85 0.6 90°S 20°S 25°N 90°N
Case # 1 Triton totally covered by CO2 frost With condensation effect No condensation effect
Case # 1 Triton totally covered by CO2 frost Retro-super-rotation
Case # 1 Triton totally covered by CO2 frost Plume ( ~8km) Wind streaks Plumes (z~8km) 60°S 40°S surface 20°S
Case # 2 Triton Unfrosted Equatorial band(from Ingersoll 1990) • Flux top = 1.15 10-6 W m-2 • Ice emissivity = 0.6 • Thermal inertia = 293 SI • Flux géothermique = 0.06 W m-2 • Albedo : 0.85 0.6 90°S 20°S 25°N 90°N
Case # 2 Triton Unfrosted Equatorial band Plume ( ~8km) Wind streaks Plumes (z~8km) Plume ( ~8km) Wind streaks Plumes (z~8km) 60°S 40°S surface 60°S 40°S 20°S surface 20°S
Case # 3 Frost Free Southern hemisphere(« Dark cap model », Hansen and Paige, 1992) • Flux top = 1.15 10-6 W m-2 • Ice emissivity = 0.53 • Thermal inertia = • Flux géothermique = 0.06 W m-2 • Albedo : 0.8 0.6 90°S 30°N 90°N
Case # 3 Frost Free Southern hemisphere(« Dark cap model », Hansen and Paige, 1992)
Case # 3 Frost Free Southern hemisphere(« Dark cap model », Hansen and Paige, 1992)
Case # 3 Frost Free Southern hemisphere(« Dark cap model », Hansen and Paige, 1992) Plume ( ~8km) Wind streaks Plumes (z~8km) 60°S 40°S surface 20°S
Triton: first findings from GCM • General results consistent with voyager observations in 1989: • « Tropopause » around 8 km • Wind streaks diection • But : Enigma : prograde winds at plume location: • Most likely : Atmospheric absorbent (CH4) • Sensitivity to Frost locations Simplified GCM used to explore the frost distributions on Triton…
New calculation of Triton seasonal variations required to compute cap evolution… (Forget et al. 2000)
Example : «Dark cap model » Suggested by Hansen and Paige (1991) Fail to explain pressure increase
Example : «Dark cap model » Suggested by Hansen and Paige (1991) Fail to explain pressure increase
High thermal inertia model (inspired by Spencer and Moore 1992) Inertia = 500 SI It works ! Show the sensitivity of the frost distribution to topography (i.e. pressure, geothermal flux assymetry)
High thermal inertia model (inspired by Spencer and Moore 1992) Inertia = 500 SI It works ! Show the sensitivity of the frost distribution to topography (i.e. pressure, geothermal flux assymetry) Also true for Pluto
Adapting Triton GCM to Pluto • Require to add radiative transfer modelling with CH4 (Strobel et al. 1995) • Solar heating at 3.3 et 2.3 µm (NLTE) • NLTE emission at 7.6 µm ? • LTE cooling by rotational lines (CO) • Very interesting atmosphere ! • Role of hazes and clouds • Like on Triton Much to learn from simplified GCM (~EBL) with interactive caps & topography • To be continued…