PHEBUS: Hermean Exosphere Probing Design with Ultraviolet Spectroscopy
The PHEBUS mission aims to measure Mercury's exosphere constituents, surface interactions, and escape rates while searching for surface ice. Operating in various observation modes, the radiometric modeling achieves a signal-to-noise ratio of 3 with a vertical scanning range from 0 to 1500 km. The instrument's ingenious design includes EUV, FUV, and NUV components, providing high spectral resolution and sensitivity to weak lines. PHEBUS also features innovative modes like Twilight and Nadir for comprehensive observations.

PHEBUS: Hermean Exosphere Probing Design with Ultraviolet Spectroscopy
E N D
Presentation Transcript
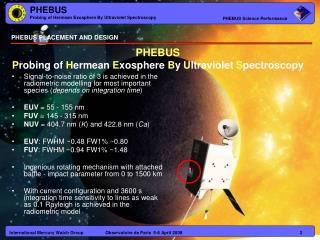
PHEBUS PLACEMENT AND DESIGN PHEBUS Probing of Hermean Exosphere By Ultraviolet Spectroscopy Signal-to-noise ratio of 3 is achieved in the radiometric modelling for most important species (depends on integration time) EUV = 55 - 155 nm FUV = 145 - 315 nm NUV = 404.7 nm (K) and 422.8 nm (Ca) EUV: FWHM ~0.48FW1% ~0.80 FUV: FWHM ~0.94 FW1% ~1.48 Ingenious rotating mechanism with attached baffle - impact parameter from 0 to 1500 km With current configuration and 3600 s integration time sensitivity to lines as weak as 0.1 Rayleigh is achieved in the radiometric model
S PHEBUS DESIGN
PHEBUS DESIGN EUV Slith Baffle NUV Mirror FUV Grating
PHEBUS MISSION OBJECTIVES • To measure the exosphere (constituents, species densities, vertical structure, seasonal-, local- and temporal variations) • To measure the coupling of the surface-exosphere-magnetosphere system • Measuring the escape rates of species from the surface and the composition of the eroding regolith • Search for surface ice in the polar regions • Low priority: Stellar- and interplanetary physics Exosphere
PHEBUS OBSERVATIONS • Twilight Mode • Vertical Scan Mode • Fixed LOS Mode • Feature Tracking Mode • Nadir Mode • Star Mode • ???
PHEBUS MODES Twilight Mode Allows search for trace species near surface and studies of the exosphere’s source and dynamics. Observations when in the shadow of Mercury. The line of sight is as low as possible with no bright emission from the surface is in the field of view Vertical scan Mode Give information on the vertical distribution and its variation with solar zenith angle Fixed LOS Mode A fixed line of sight respective to the spacecraft. A slow vertical scan is obtained from the altitude variation of the spacecraft. Gives information about local density of observed species along the orbit
Line of sight Line of sight PHEBUS MODES Feature tracking Mode The LOS moves slightly as in Twilight Mode to follow a feature (or altitude range) along the orbit Nadir Mode The LOS is pointed towards the Nadir on the nightside of the orbit and at high latitude which records the reflectivity of the surface by interplanetry glow (water, sulphur…) Star Mode The aim of the star mode is to follow the ageing of the instrument. Observation of some hot stars within the spectral range 100-300 nm. The number of available stars within the Phebus field of view is TBD (by me!).
PHEBUS MODES ? Tail mode (under construction)
PHEBUS MODELING: Radiometric Model Instrument Response Different reactions due to different photocathodes Not perfectly reflective Depends on the separation of the two gratings and the reflectance of coating Constraints of field of view and stray light
RADIOMETRIC MODEL: Instrument Response and spectra generation • Raw list of species with their assumed intensities (preliminary since Mercury’s exosphere is virtually unexplored) • List of species subjected to the instrument response • ‘Spectrum’ of the species list after addition of noise – 1 s integration time 1. 2. 3. blue arrow is oxygenat 130,4nm – ‘easily’ detectable red arrow is clorine at 133,6 nm – ‘difficult’ to detect
RADIOMETRIC MODEL: Instrument Response 600 seconds 10 seconds 60 seconds 3600 seconds With increasing time the dark current will overtake some lines and change line-ratios
RADIOMETRIC MODEL: Signal-to-Noise Ratio Species detectable: < 60 s (to make thorough investigations) EUV: He I, CO, O I, H I, C I, N I FUV: Mg I, Si I, Na I, C I, Fe I, S I, Al I, CO, Ni I, Mg II, OH, Ca I, Fe II, H2 >> 3600 s (to confirm that the species exist) EUV: Kr I, Ar I, Cl I and Si II FUV: Al II and Si II Numbers in the tables are integration time in seconds
RADIOMETRIC MODEL: Detection limit 1-10 s int. time gives lower limit of 10 R 1-10 s int. time gives lower limit of 20 R The lowest (integration time of 3600 s) mean detection limit can thus be estimated to: EUV range: ~ 0.1 Rayleigh FUV range: ~ 0.2 Rayleigh red dotted line marks the limit of 0.1 R red area marks most common utilised integration time 1-10 s int. time gives lower limit of 5 R
Signal-to-noise ratio of 3 Spectral range of 55 - 315 nm and the NUV of 404 nm and 422 nm Spectral resolution: FWHM < 1 nm for EUV, < 1.5 nm for FUV. FW1% < 2 nm for EUV and < 3 nm for FUV A vertical scanning range equivalent to an impact parameter from 0 to 1500 km Vertical resolution of ~ 1/2 scale height on most species(~ 20 km). From apoherm this gives spatial resolution ≥ 0.37° Sensitivity to lines as weak as 0.1 Rayleigh PHEBUS DESIGN ACHIEVEMENTS • Is achieved in the radiometric modelling for most important species (depends on integration time) • EUV = 55 - 155 nm, FUV = 145 - 315 nm, NUV = 404.7 nm and 422.8 nm • EUV: FWHM ~0.48FW1% ~0.80 FUV: FWHM ~0.94 FW1% ~1.48 • Ingenious rotating mechanism with attached baffle • With margin the spatial resolution is ~0.4° in the current evaluation of the geometric performance • With current configuration and 3600 s integration time this is achieved in the radiometric model for EUV ~0.1 R (FUV ~0.2 R)