Download

1 / 24
240 likes | 358 Views
A Decision Support System for Ecosystem-Based Management of Tropical Coral Reef Environments. F. Muller-Karger, M. Eakin, L. Guild, C. Hu, M. Vega, R. Nemani, T. Christensen, L. Wood, C. Ravillious, C. Nim, J. Li, C. Fitzgerald, J. Hendee, L. Gramer, S. Lynds . Partnerships.

E N D
A Decision Support System for Ecosystem-Based Management ofTropical Coral Reef Environments F. Muller-Karger, M. Eakin, L. Guild, C. Hu, M. Vega, R. Nemani, T. Christensen, L. Wood, C. Ravillious, C. Nim, J. Li, C. Fitzgerald, J. Hendee, L. Gramer, S. Lynds
Partnerships • NOAA NESDIS/CRW-CRCP (Mark Eakin, Tyler Christensen) • NOAA AOML / ICON/CREWS-CRCP (James Hendee) • NASA Headquarters (Woody Turner, Paula Bontempi) • NASA Ames (Liane Guild, Ramakrishna Nemani) • UNEP-WCMC (Louisa Wood, Corinna Ravilious, Claire Fitzgerald) • University of South Florida (Frank Muller-Karger, Chuanmin Hu, Maria Vega) • (Welcoming a partnership with Australia!)
Acknowledgements • Funding provided by: • NASA Applications Program • Woody Turner • 2008 Ecological Forecasting application area • 4-year program (2008-2013) • NOAA • NESDIS Coral reef Watch
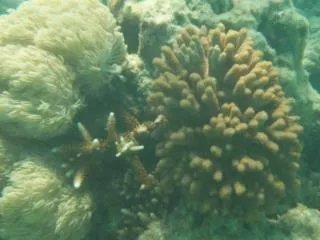
Location of shallow tropical coral reef ecosystems (Source: ReefBase). The four coral reef biogeographic regions that are typically recognized by marine biogeographers are shown in circles: (1) Indian, (2) Indo-Pacific, (3) Pacific and (4) Caribbean. Coral Biogeography
Coral: Socio-Economic Importance • Considering: • potential for human food supply • recreation and management (i.e. marine protected area monitoring and regulation) • socio-economic value: ~US$6,000 /Ha/year (Costanza et al. 1997). • (swamp/floodplains ($8,000 ha/y), wetlands ($5,000 ha/y), mangroves ($3,000 ha/y), estuaries ($1,500 ha/y)) -up to $675 billion annually in fish, seafood, tourism, and coastal protection worldwide -$17 billion in U.S. tourism -1 billion people rely on reef fish for food
Tropical Coral Reefs: Ecosystems under Stress • Over 60% of the world's reefs are under threat. • Factors: • increasing temperature, • increasing dissolved inorganic carbon in ocean waters, • increased use of coastal resources including fishing, • coastal development, • pollution
NOAA Coral Reef Watch(Mark Eakinand team / NESDIS)Mission To provide remote sensing tools for the conservation of coral reef ecosystems. Coral Reef Watch aims to assist in the management, study, and assessment of impacts of environmental change on coral reef ecosystems.
NOAA: Coral Reef Watch • NOAA Coral Reef Watch DSS: • empirical models and the AVHRR Global Area Coverage • near-real time suite of products to monitor and forecast thermal stress that may cause coral bleaching • Products: • night-time only 50 km SST anomaly, • coral bleaching HotSpots, • Degree Heating Weeks, and • Satellite Bleaching Alerts. • http://www.osdpd.noaa.gov/PSB/EPS/SST/methodology.html.
CRW-Operational SST-based products Operational 2002 2002 2002 2003 50km Nighttime Sea Surface Temperature (SST) 2009 SST Anomaly Coral – specific HotSpot Degree Heating Week Bleaching Alert Areas Primary Products: AVHRR SST-based
NOAA CRW DSS DHW corresponds to one week of SST exceeding the maximum summer SST by one ºC. A value of two DHWs indicates two hot weeks, but is also equivalent to one entire week of SST exceeding the maximum summer SST by two ºC. The 2005 Bleaching Event in the Western Hemisphere. The image shows the Degree-Heating Weeks (DHW) accumulated through 1 November, 2005. Note high DHW (yellow-orange colors) in the eastern Caribbean Sea. Significant bleaching took place in the U.S. Territories and adjacent islands.
Objectives of NASA-NOAA-USF Program • Assess value of high-spatial resolution SST data (MODIS, AVHRR) and the Global Coral Reef Millennium Map (Landsat) to improve the NOAA Coral Reef Watch decision support system (CRW DSS) • Help further develop the CRW DSS • Develop end-to-end evaluation and feedback mechanism to meet user needs. • Link to plans for: • Hyperspectral and Infrared Imager (HyspIRI) • Landsat Data Continuity Mission (LDCM) • NPP, NPOESS, other environmental satellites
Help develop the CRW DSS includes: • Assess value of existing CRW products. • Span scales: from ICON/CREW high temporal & spatial resolution to global CRW • Evaluate optimal spatial and temporal resolutions for coral reef applications. • Experimental 1, 4, and 50 km spatial resolution products from MODIS and AVHRR. • Validate in partnership with NOAA ICON/CREWS • Consider enhanced stress indices (e.g. cold, heat, water quality, other) • Integrate Coral Reef Millennium Map products. • Visualization and “knowledge” interface, tailored to monitoring and policy-making.
Evaluation component • Cooperative Institute for Research in Environmental Sciences (CIRES) at the University of Colorado at Boulder • (Mark Mcaffrey, Susan Lynds) • Will verify that the program meets goals of the NASA Applied Sciences Program • Will assess: • Efforts to document development of products and tools • Effort to solicit feedback and assistance on use and usability • Effort to learn whether the task meets the needs of identified stakeholders
Sample product: Global DHW* Rama Nemani and NASA Ames supercomputer Accumulation of 12 weeks of hotspots by the first week of January 2008 at moderate (8 km) resolution.
Figure 5. Sample Millennium Map products for the Florida Keys displayed on Google Earth. Figure 4. Sample Millennium Coral Reef Map geomorphological classification, based on Landsat-7 data. Sample product: Millennium Map
Florida Keys and Puerto Rico: high-res test sites Map of FKNMS showing various water zones. The map covers an area from 24.09◦ N to 26.23◦ N and from 83.22◦ W to 79.9◦ W. The circled crosses show locations of the NDBC stations. Base map courtesy of Kevin Kirsch (FKNMS).
High-resolution Degree Heating Week example Left: 50-km DHW product Right: Equivalent 1-km DHW product for 3-day period ending on August 20, 2005 Land mask colors are reversed between the images with zero DHW shown as black in the NOAA image and white in the USF image. Reference: Building an Automated Integrated Observing System to Detect Sea Surface Temperature Anomaly Events in the Florida Keys. 2009. Chuanmin Hu, Frank Muller-Karger, Brock Murch, Douglas Myhre, Judd Taylor, Remy Luerssen, Christopher Moses, Caiyun Zhang, Lew Gramer, and James Hendee. IEEE TRANSACTIONS ON GEOSCIENCE AND REMOTE SENSING, VOL. 47, NO. 6, JUNE 2009
High resolution preserves spatial patterns of importance to reefs • High-resolution (1-km) AVHRR SST imagery (NOAA-16 satellite) showing small-scale (∼1020 km, ∼< 1 ◦C) frontal eddies (annotated with black arrows) along the shallow isobaths in the Florida Straits • January 22, 2002 at 7:36 GMT and January 23, 2002 at 18:45 GMT. • Eddies are due to shelf wave dynamics, and they cannot be detected by other coarser resolution data (4 km or lower).
Other possible “enhancements” and joint work • Cold water stress index • Marine Spatial Planning support via CRW • Variables: SST, CHL, SSH, other? • Access monthly (weekly) climatologies per pixel • Long-term time series • Trends in variables • Plotting and data extraction • Millennium: KristianTeleki had proposed a visualization and “knowledge” interface, tailored to monitoring and policy-making.
January 25 – February 17, 2010 78 sites were surveyed across the Florida Reef Tract from the Lower Keys to Martin County Areas impacted the most were the inshore and mid channel zones from Summerland Key in the lower Keys through Biscayne National Park. Forereef zones region-wide, reefs west of Summerland Key and reefs north of Biscayne National Park were, much less affected but were highly impacted. Highest coral mortality seen in the last 5 years. Frequent observations showed that corals would generally pale for a day then die. All species were affected Cold water stress monitoring
Florida Reef Tract SST between 10º C – 21º C Critical low SST temperature threshold is ~ 13° C: mass mortality in scleractinian coral communities Dr. Tianran Chen, South China Sea Institute of Oceanology, Guangzhou, China
Additional Cases Reported Saudi Arabia, Northern Gulf Reported in February 2010 Lowest water temp. ~10° C Affected Species: Acropora Miami, Florida 1969/70 (snowed) Affected Species: Acropora Never proliferated in Dry Tortugas The Daya Bay, Northern South China Sea During Cold Events: Mean SST for February fall to < 14℃, including six continuous days at 12.3℃. Observed coral taxa such as Turbinaria peltata, Plesiastrea versipora and Acropora pruinosa, suffer from cold-water stress. Staghorn coral, wikipedia
SUMMARY -Partnership established between NASA, NOAA, USF to further develop the Coral Reef Watch DSS -Elements will include user surveys and ground validation -Products will include NASA products (MODIS, Landsat Millennium Coral Reef Map) -Pathfinder for higher resolution missions (HyspIRI, LDCM, VIIRS/NPP) -Next team meeting: 9-10 December 2010, NASA Ames