Download
1 / 54
540 likes | 561 Views
Explore database basics, data quality, and key concepts in education, focusing on efficient data use for policy and practice improvement.

E N D
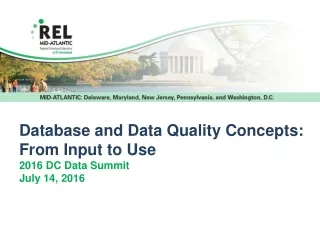
Database and Data Quality Concepts:From Input to Use2016 DC Data SummitJuly 14, 2016
REL Mid-Atlantic One of 10 RELs, REL Mid-Atlantic serves: Delaware District of Columbia Maryland New Jersey Pennsylvania
REL Mid-Atlantic goals • To help stakeholders, state and local education agencies, communities, researchers: • Gain access to and use high-quality research • Use research, data, and data analysis to improve policy and practice • To respond to high-priority education needs of the region
Today’s Presenter Nancy Smith CEO and Principal Consultant at DataSmith Solutions, LLC www.datasmithsolutions.com
Percentage of Students by Race/Ethnicity Receiving Special Education Services, District A
Percentage of Students by Race/Ethnicity Receiving Special Education Services
Different users and uses of data Program Evaluation and Grant Evaluation School and District Report Cards Teacher Evaluation Federal Compliance Research and Graduate Students Resource Allocation Press Complaints and Investigations Legislature Student Growth Accountability Funding Tables Early Warning System
Data Flow – From Raw to Refined School & LEA staff may have one access point. State agency staff may have another. State data system does not incorporate all LEA data sources Many, but not all, from LEAs or external sources Internal & external uses & users Aggregate information, charts, graphs or Student dashboards for use by faculty or administrators
What are the Risks of Poor Quality Data, Bad Database Design, or Poorly Designed Reports? • Not enough funding to District based on inaccurate Average Daily Attendance figures • Difficult to gauge number of teachers and aides needed to meet student needs for upcoming cohorts • High need for remediation courses in college • Cannot easily find the information needed to inform policy or the public • # students enrolled in charter schools found on page 231 of a report
Basic Tenet of Database Design AND But in education so many databases were built so long ago and so much has changed over time.
Databases or Data System Program Participation Table Student Table Assessment Table Each table (e.g., Excel spreadsheet, data table in a larger data system) is technically a database in and of itself Tableor file describe a single table covering one type of data Database describes a collection of tables Large database systems (or databases) have many different tables, each with a distinct type of data in them (e.g., enrollment, assessment, program participation, course records; student, staff, campus, district)
Student Table Class = Table Attributes = columns Object = row
Relational DatabaseAble to connect student, staff, campus and district data to each other through Primary Key(s)
Primary Keys PREMISE: ALL records in a table must be unique Must be able to connect records from different datasets or tables together correctly Key = a field or combination of fields that is guaranteed to have a unique value for every record in the table Must be named, defined and coded the same way across different tables. Example: Student ID #, First Name, Last Name
Student Table Primary Key? Student ID only Student ID, First Name and Last Name Student ID, First – Middle – Last, Birthdate, Gender, Race/Ethnicity Is the second record a unique student record or a duplicate with typos?
Student Course Table 2012-13 Some tables have multiple records for the same individual Primary Key(s): Student ID Location Code District Code Course Number Course Section Number
Examples of Connecting Across Tables • Student files • Demographics • Program Participation • Assessment • Course Enrollment • Teacher files • Demographics • Experience • Course Data School Years 2012-13 and 2013-14 - (example contains limited number of data elements for each file)
Student Files 2012-13 Demog_13: “_13” reflects the academic year 2012-13; Demog_14 would reflect 2013-14 data
Connect Student Records to Analyze Test Scores of Low Income Students by District within a School Year Red=1st Primary Key Blue=Additional Primary Keys Green=Outcome Variables
Connect Student Records to Compare Average Test Scores across Two Years by District District # can be both primary key and outcome or grouping variable Red=1st Primary Key Blue=Additional Primary Keys Green=Outcome Variables
Connect Student, Teacher and Courseto See if Years of Experience Make a Difference Any need for Campus or District Directory Information? Red=1st Primary Key Blue=Additional Primary Keys Green=Outcome Variables
Ensuring High Quality Data Timeliness: submission of files by the due date and with enough time to correct any formatting or validation errors before the analysis deadline; Accuracy: the degree of conformity, precision and correct representation of specific attributes of the student, teacher, school and/or district Consistency/Reliability: the degree to which a set of data are equivalent in different databases; and Validity: the degree to which data conforms to defined business rules and the degree to which data reflect what they are intended to measure, such as valid assessment scores.
Data Quality Issues Clearly defining data standards is key to ensuring high data quality, Must receive data formatted in same way for every district, school, student, teacher, etc. Minimize data cleansing and interpretation at State Education Agency => faster turnaround for use and more confidence .
Data Standards • The way to map and align data from different data sources together in order to paint a complete picture • Common Vocabulary • Data Dictionary with element names, definitions, option sets • Data should be at the most granular level to allow detailed analyses
Key Features of a Data Elementto Make Explicit in Data Standards Name – Simple, As few words as possible Definition – meaning of the data element Code Table – list of acceptable values & their meaning Length – number of digits or characters allowed Data Type – Numeric (whole number) only, Character/Alphanumeric (string), Categorical, Boolean (true or false), Decimal Pattern – symbols, MM, DD, YYYY, HH=hour, MM=minute Special Instructions – e.g., can only accept grade levels EC, PK, KG, 01-12; can’t be 6 years old and in grade 12 Mandatory – Yes/No Formula – if is a calculated value, explain how to calculate it (what variables)
Resources to Learn about Data Standards • State Data System Manuals • SIS Vendor manuals, vendor codebooks • Common Education Data Standards • Developed by USED in partnership with SEAs, LEAs and Institutions of Higher Education and others • Robust input from stakeholders • https://ceds.ed.gov
Data Quality Checks Business Rules Expected Values and Outliers Year-to-Year Trends Comparison to Other Schools in District or to other Districts Underreported or over reported Students in a category
Example of a State’s Business Rules Error • Age = 7 • Grade = 12 Error • Special Education = N • Challenge Type = 2128 for Specific Learning Disability • Only use challenge type if Special Education = Y or E Error • CTE Indicator = Y • Location Code not = Occupational & Comprehensive CTC School
Under or Over Reported Example: students who transferred or dropped out Reported as transferred to another school, but enrollment records don’t indicate they enrolled anywhere else in state Reported as dropped out, but enrollment records show they enrolled in another district later that year
Data Analysis for Data Quality, Program Evaluation and Decision Making Look for questionable trends over time Identify schools or districts that have data quality issues Identify districts that might need site visits or technical assistance with data or program area specifics Look at campus performance over time to identify possible issues in a grade and/or subject area
Data Analysis for Data Quality, Program Evaluation and Decision-Making