FEMA Flood Mapping and Market Opportunities
370 likes | 394 Views
Learn about FEMA's flood mapping, market drivers, and potential opportunities for aerial and survey companies in floodplain analysis.

FEMA Flood Mapping and Market Opportunities
E N D
Presentation Transcript
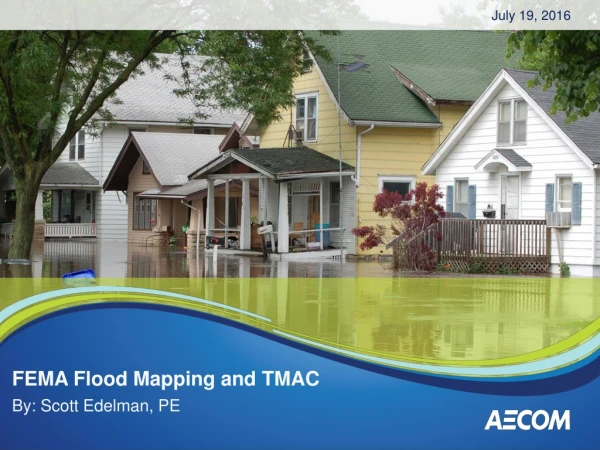
July 19, 2016 FEMA Flood Mapping and TMAC By: Scott Edelman, PE
Agenda • Overview • Background • Market Drivers – Congress / FEMA / TMAC • Potential Floodplain Market Opportunities for Ariel and Survey Companies • Questions July 19, 2016 Page 1
Overview • High resolution topographic data is required for the nation • Building locations and footprints are needed for buildings within and near the 1% floodplain • First floor elevations are needed for buildings located within and near the 1% floodplain July 19, 2016 Page 2
Background • Uncertainty of Calculations • In-Out Determination July 19, 2016 Page 3
We need to inform the public on the underlying assumptions July 19, 2016 Page 4
ASSUMPTION Structures will operate properly and will not fail
ASSUMPTION Structures will not be blocked with debris
ASSUMPTION Only existing conditions are reflected on the maps
FEMA / AECOM National Climate Change Report Releasedby Whitehouse June 2013 Example Change: Q100 • SIGNIFICANT TECHNICAL FINDINGS: • By Year 2100 riverine floodplains will increase by 50% in size, • Coastal areas will increase by 55% in size • SIGNIFICANT FINANCIAL FINDINGS IN TODAY’S DOLLARS: • Average loss cost per policy will increase by approximately 90% • Individual premiums will increase 10% to 40%
We have confused the public with different definitions AN AVERAGE AN ABSOLUTE Bridge Standard Flood Plain Elevation
Statistics use confidence limits to show range of likely results
Statistics use confidence limits to show range of likely results
What Causes Sea Level to Change? • Thermal expansion (~ 1 meter potential) • Water exchange with continents (potential) • Greenland ice (7 meters) • Antarctic ice (60 meters) • Mountain glaciers (0.5 meter) • Terrestrial water storage variations (< 0.5 meter) • Other (halosteric, etc.) ∆SL Total = ∆SL Thermosteric+ ∆SL Greenland + ∆SL Antarctica+ ∆SL Glaciers+ ∆SL Storage+ ∆SL Other SOURCE: Doug Marcy NOAA December 2014c
Greatest source of uncertainty? Source: NASA SOURCE: Doug Marcy NOAA December 2014c
Just give me a number – please! SOURCE: Doug Marcy NOAA December 2014c
Variability within IPCC projections July 19, 2016 Page 16
Global SLR scenarios We also know of course that sea level change will vary regionally and locally SOURCE: Doug Marcy NOAA December 2014c; Parris et al, 2012
IPCC Uncertainty July 19, 2016 Page 20
In / Out Challenges July 19, 2016 Page 21
Market Drivers • BW-12 • TMAC • Congressional Support July 19, 2016 Page 22
BW-12 July 19, 2016 Page 23
What is TMAC? TMAC = Technical Mapping Advisory Council The TMAC provides advice and recommendations to the Administrator of FEMA. The duties of the TMAC are solely advisory in nature.
TMAC Overview • Federal advisory committee • established by the Biggert-Waters Flood Insurance Reform Act of 2012 • amended by the Homeowner Flood Insurance Affordability Act of 2014 July 19, 2016 Page 25
Objectives of TMAC • How to improve in a cost-effective manner the: • Accuracy, general quality, ease of use, and distribution and dissemination of flood insurance rate maps and risk data; and • Performance metrics and milestones required to effectively and efficiently map flood risk areas in the United States.
Objectives of TMAC • Mapping standards and guidelines for: • Flood Insurance Rate Maps (FIRMs); and • Data accuracy, data quality, data currency, and data eligibility; • How to maintain, on an ongoing basis, FIRMs and flood risk identification; and • Procedures for delegating mapping activities to State and local mapping partners.
Objectives of TMAC • The TMAC recommends to the Administrator and other Federal agencies participating in the Council: • Methods for improving interagency and intergovernmental coordination on flood mapping and flood risk determination; and • A funding strategy to leverage and coordinate budgets and expenditures across Federal agencies.
TMAC Resources • www.fema.gov/TMAC
2015 Annual Report • Recommendations are aligned to 9 Topic Areas • Community of Users and Uses • Flood Hazard Identification – Program Goals & Priorities • Flood Hazard Identification – Core Data, Models and Methodologies • Flood Hazard Identification – Production Processes • Flood Risk Assessment and Communication • Data Management and Distribution • Federal Partner Collaboration • Cooperating Technical Partners • Maintenance and Funding July 19, 2016 Page 30
Recommendations – Transformative • #10 - FEMA should transition from identifying the 1-percent-annual-chance floodplain and associated base flood elevation as the basis for insurance rating purposes to a structure-specific flood frequency determination and associated flood elevations. One of FEMA’s non-regulatory datasets provides the percent annual chance of flooding for a watershed . July 19, 2016 Page 31
Recommendations – Transformative • #14 - : FEMA and its mapping partners, including the private sector, should transition to a flood risk assessment focus that is structure specific. Where data are available, FEMA and its partners should contribute information and expertise consistent with their interest, capabilities and resources towards this new focus: • a) A necessary prerequisite for accurate flood risk assessments is detailed flood hazard identification, which must also be performed to advance mitigation strategies and support loss estimations for insurance rating purposes. • b) FEMA should initiate dialogue with risk assessment stakeholders to identify potential structure-specific risk assessment products, displays, standards, and data management protocols that meet user needs. • c)FEMA and its partners should develop guidelines, best practices, and approaches for implementing structure-specific risk assessments. North Carolina’s FRIS provides risk information at the structure level . July 19, 2016 Page 32
Recommendations – Transformative • #16 - FEMA should transition from the current panel-based cartographic limitations of managing paper maps and studies to manage NFIP data to a database derived, digital display environment that are fully georeferenced and relational, enabling a single digital authoritative source of information and database-driven displays. Towards this transition FEMA should: • a) Prepare a multi-year transition plan to strategically transition all current cartographic and/or scanned image data to a fully georeferenced, enterprise relational database. • b) Update required information for map revisions (MT-2 forms) and LOMC applications to ensure accurate geospatial references, sufficient data to populate databases, and linkages to existing Effective data. • c) Adopt progressive data management approaches to disseminate information collected and produced during the study and revision process, including LOMCs. • d) The data management approach should be flexible to allow efficient integration, upload, and dissemination of NFIP and stakeholder data (e.g., mitigation and insurance data that is created and maintained by other Federal agencies), and serve as the foundation for creating all digital display and mapping products. • e) Provide a mechanism for communities to readily upload jurisdictional boundary data, consistent with requirements to participate in the NFIP, as revised, allowing other stakeholders access. . July 19, 2016 Page 33
Potential Market Impacts of TMAC Recommendations for Aerial and Survey Industry • High resolution topographic data is required for the nation • Building locations and footprints are needed for buildings within and near the 1% floodplain • First floor elevations are needed for buildings located within and near the 1% floodplain • A 2012 Dewberry study showed 14.5 million structures within the 100-year floodplain. • A 2009 AECOM study showed an additional 6.8 million structures in the 500-year floodplain. • This would give a total estimate of 21.3 million structures. • For building footprints and first floor elevations, if the cost is approximately $25 a structure, the bare cost would be $500MM. If one adds unknowns and management, the cost would be $750MM. July 19, 2016 Page 36
How can MAPPS help? • Contribute on areas that can be improved • Submit a whitepaper on MAPPS position • Suggest topics TMAC should consider in future years • Be available for SME’s • Provide input via the public comment period July 19, 2016 Page 37
Thank you July 19, 2016