Download
1 / 10
100 likes | 114 Views
This experiment aims to explore the relationship between changing variables and their impact on a dependent variable. By varying certain factors and measuring corresponding outcomes, the experiment will provide insights into potential cause-effect relationships.

E N D
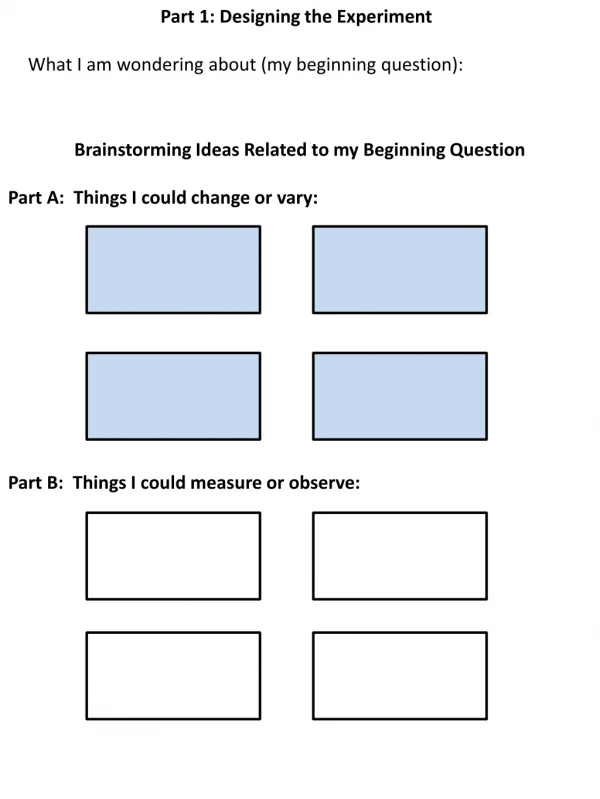
Part 1: Designing the Experiment What I am wondering about (my beginning question): Brainstorming Ideas Related to my Beginning Question Part A: Things I could change or vary: Part B: Things I could measure or observe:
Identifying Variables I will change: I will measure or observe: Place sticky note from Part A here Place sticky note from Part B here I will not change (I will keep these the same so my test is fair): Place remaining sticky notes from Part A here Place remaining sticky notes from Part A here Place remaining sticky notes from Part A here I will not measure or observe: Place remaining sticky notes from Part B here Place remaining sticky notes from Part B here Place remaining sticky notes from Part B here
Asking a Testable Question (Refining my beginning Wondering) When I change _______: What happens to _______? What I will measure or observe What I will change Write the question that will guide your experiment: Based on prior knowledge, what do you already know about this? Predictions (Note: List 3 possible outcomes: Increase, Decrease, and No Affect.) Based upon my question, I predict: Circle the number you want to investigate 1. 2. 3.
Research Sources: List the information you collected during your research: Hypothesis: If………………………………………………………….THEN……………………… ............................... BECAUSE………………………………………………. ……………………………………………………………………………………………..
The Procedure (Note: Others should be able to follow the way you set up your fair test) Materials List (detailed) Directions (List exactly what you did in each step of your experiment) Set-Up Conditions/Controls (What conditions should be kept constant?) • Place remaining sticky notes from Part A here • Place remaining sticky notes from Part A here
What I will change or vary (independent variable): What I will change What I will do to carry out the change: Number of trials I will conduct or amount of samples to include: ______ The data I will collect by measuring or observing (dependent variable): What I will measure or observe How I will collect the data: How I will record the data (for example: table, chart, picture):
Part 2: Carrying Out the Experiment Data Collection: When I changed _____, what measurements or observations resulted? What I will measure or observe (dependent variable) What I will change (independent variable) Record your Data:(Note: This is intended simply as an example to help get you started. You may design your own chart to fit your experiment.)
Graphing Results Which type of graph is best- line graph or bar graph? ______________ Graph: should reflect mean average of trials What I will measure or observe (dependent variable) Y axis What I will change (independent variable) What I will change (manipulated variable) X axis (Note: Both axes will need to be labeled and the appropriate scale marked)
Title of Graph: __________________________ Y-axis: ______________________________________ X-axis: ______________________________________ When I changed ____________, what happened to ____________? What I measured or observed (dependent variable) What I changed (independent variable)
Results/Explanation • Summarize what you discovered from this experiment. Include: • Looking at your graph, describe your results (patterns or relationships • shown by your data) using mathematical language. • Write an explanation that reflects your predictions and data in your • experiment. • Explain real world uses relating to research and the experiment. • Any new questions for further investigation- what else do you wonder • about?


