Download
1 / 13
130 likes | 268 Views
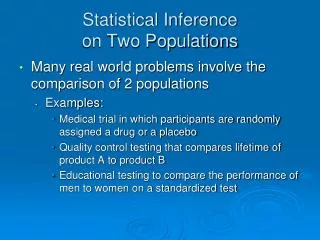
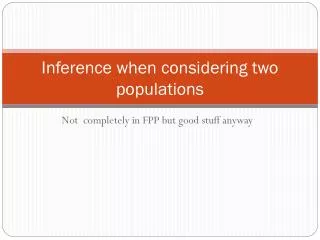
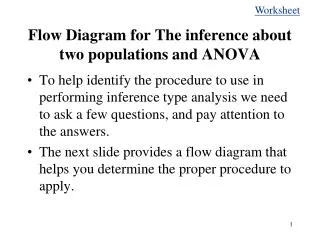
Flow Diagram for The inference about two populations and ANOVA. To help identify the procedure to use in performing inference type analysis we need to ask a few questions, and pay attention to the answers.

E N D
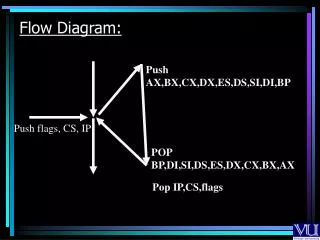
Flow Diagram for The inference about two populations and ANOVA • To help identify the procedure to use in performing inference type analysis we need to ask a few questions, and pay attention to the answers. • The next slide provides a flow diagram that helps you determine the proper procedure to apply.
1. How many populations? 2. Define the parameters tested (in words). Paired observations? No Are there any characteristics common to groups of observations? Yes Yes No Define mD;H0: mD = 0H1: mD >,<, ¹0 Check whether s12 = s 22 using the F-test Run a randomized block design ANOVA Run a Single factor ANOVA No Yes s12 = s 22 ? Run a t-test for m1-m2 with pooled variance estimate (Sp2) Run a t-test for m1-m2 Use S12 and S22 to construct the t-statistic The Flow Diagram 2 Populations 3 Populations
Review Problem # 1 One factor in low productivity is the amount of time wasted by workers. Wasted time includes time spent cleaning up mistakes, waiting for more material and equipment, and performing any other activity not related to production. In a project designed to examine the problem, an operations management consultant took a survey of 200 workers in companies that were classified as successful (on the basis of their latest annual profits) and another 200 workers from unsuccessful companies. The amount of time (in hours) wasted during a standard 40-hour workweek was recorded for each worker. These data are stored in columns 1 (successful companies) and 2 (unsuccessful companies) in file “Productivity”.
Do these data provide enough evidence at the 1% significance level to infer that the amount of time wasted in unsuccessful firms exceeds that of successful ones? • Estimate with 95% confidence how much more time is wasted in unsuccessful firms than in successful ones.productivity.xls
Review problem # 2 • Ikarus, the Hungarian bus maker, has lost its important CIS market and is reported on the verge of collapse. The company is now trying a new engine in its buses and has gathered the random samples of miles-per-gallon figures for the old engine versus the new provided in file “Ikarus”. • Is there evidence that the new engine is more economical than the old one?Ikarus.xls
Review Problem # 3 The president of a large company is in the process of deciding whether to adopt a lunchtime exercise program. The purpose of such programs is to improve the health of workers and, in so doing, reduce medical expenses. To get more information she instituted an exercise program for the employees in one office. The president knows that during the winter months medical expenses are relatively high because of the incidence of colds and flu. Consequently, she decides to record medical expenses for the 12 months before the program and for 12 months after the program. The "before" and "after" expenses (in thousands of dollars) are compared on a month-to-month basis and shown in file “Expenses”.
Do the data indicate that exercise programs reduce medical expenses? (Test with a = .05.) • Estimate with 95% confidence the mean savings produced by exercise programs.Expenses.xls
Review Problem # 4 uh ah.xls A study performed by a Columbia University professor (described in Report on Business, August 1991) counted the number of times per minute professors from three different departments said "uh" or "ah" during lectures to fill gaps between words. The data derived from observing 100 minutes from each of the three departments are stored in file “uh-ah” (Column 1 contains all the data for the English department, column 2 stores the data for the mathematics department, and column 3 stores the data for the political science department.) If we assume that the more frequent use of "uh” and "ah" results in more boring lectures, can we conclude at the 5% significance level that some departments' professors are more boring than others?
Review Problem # 5 The friendly folks at the IRS are always looking for ways to improve the wording and format of its tax return forms. Three new forms have been developed recently. To determine which, if any, are superior to the current form, 120 individuals were asked to participate in an experiment. Each one of the three new forms, as well as the currently used form, were filled out by 30 different people. The amount of time (in minutes) taken by each person to complete the task was recorded and stored in File “IRS”. The sample means and standard deviations were computed as follows.
Form 1: mean = 90.17, standard deviation =31.49. • Form 2: mean = 95.77, standard deviation = 30.01. • Form 3: mean = 106.83, standard deviation = 30.47. • Form 4: mean = 111.17, standard deviation 31.99 • What conclusion can be drawn from these data? (Use ? =.05) • What are the required conditions for the test conducted above? Does it appear that the required conditions of the test are satisfied? IRS.xls • Can you determine which one of the forms takes the shortest time to fill in? Use a = .05
Review Problem # 6 Many North Americans suffer from high levels of cholesterol, which can lead to heart attacks. For those with very high levels (over 280), doctors prescribe drugs to reduce cholesterol levels. A pharmaceutical company has recently developed three such drugs. To determine if any differences exist in their benefits, an experiment was organized. The company selected 25 groups of three men, each of whom had levels in excess of 280. In each group, the men were matched according to age and weight. The drugs were administered over a two-month period, and the reduction in cholesterol was recorded. The data are stored in the first three columns of file Cholesterol. Do these results allow the company to conclude at the 5% significance level that differences exist among the three new drugs?
Review Problem # 7 Phonex provides call center services for many different companies. One of four cities is being considered where a new call center is to be established. Managers will have to be transferred to the new location, and Phonex tries to find whether differences in housing prices exist across the four competing cites. Having concerns about the large variability among house prices due to house age and size, each house observed was classified by age +size category, and its price then recorded. See Phonex.xls. • At 5% significance level, is there evidence to conclude that on the average house prices differ among the four cities? • Is it necessary to match house by Age+Size in the three cities (Alpha = 5%) • Answer to the best of your ability: Which city is most preferred in terms of house prices?
Review Problem # 8 GroBros., A regional grocery store chain, is considering to upgrading to a new series of price scanners. Scanners sometimes have errors, and GroBros. wants to evaluate the average levels of such errors for 4 different types of scanners(the current one, and three new ones). Thirty different shopping baskets were defined (which differ in the number of items, and the types of items included). Each basket was scanned four times (by each scanner) and then item prices were determined by hand. The number of scanning errors in each basket was recorded. See file GroBros.xls. a. State the hypothesis of interest for this test. b. At 1% significance level, is there a difference between the number of errors among the scanners?