Natural-Spawning Population Trends Through 2001 Returns
170 likes | 300 Views
Natural-Spawning Population Trends Through 2001 Returns. Overview For TMT November 5, 2003 Chris Toole, NOAA Fisheries. Summary of October 1, 2003, Report to Court, Exhibit D: Preliminary Estimates of Updated “Indicator Metrics” Applied in the 2000 FCRPS Biological Opinion

Natural-Spawning Population Trends Through 2001 Returns
E N D
Presentation Transcript
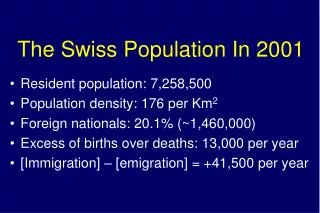
Natural-Spawning Population Trends Through 2001 Returns Overview For TMT November 5, 2003 Chris Toole, NOAA Fisheries
Summary of October 1, 2003, Report to Court, Exhibit D: Preliminary Estimates of Updated “Indicator Metrics” Applied in the 2000 FCRPS Biological Opinion http://www.salmonrecovery.gov/remand/court_docs/federal_defendants_first_quarterly_status_report/d_Population_Status_Report.pdf
Population Data Availability • Immediately Available – Dam counts by species/ESUs, mixed wild and hatchery • Some Months Later – Dam counts by species/ESU and by wild and hatchery fraction; raw spawner/redd counts in some areas • A Year Or More Later – Final spawner estimates and/or redd counts by population, including (where applicable) hatchery/wild fractions, redd count expansions, age structure, etc.
Data Sources Through 2001 • Many reports by states, tribes, FWS, PUDs, etc. • Collated and reviewed by NOAA Fisheries Biological Review Team (BRT) for new Status Review • Data sets for Interior ESUs and Lower Columbia/Willamette ESUs at: http://www.nwfsc.noaa.gov/trt/brtrpt.htm • Schedule for data through 2002, 2003
What We Did To the Data Sets • BRT evaluated status, using a number of ways of looking at the data, and released February 2003 draft Status Review. • NOAA Hydro Program used data to update estimates of the jeopardy “indicator metrics” used in 2000 FCRPS Biop. Based on population growth rate (“lambda”) and other metrics derived from lambda. • SimSalmon: SimSalmon is an analytical tool developed by Paul McElhany and John Payne (2001), one module of which estimates lambda and extinction risk using the Dennis/Holmes method - http://research.nwfsc.noaa.gov/trt/viability_simSalmon.htm
First Step – Updated Spawner or Redd Count Estimates Example: Marsh Creek Population of Snake River Sp/Sum Chinook
Next step in estimating the trend with the Dennis/Holmes method is to generate 4-year running sums. This reduces sampling bias and makes adult counts proportional to counts of all life stages.
An exponential trend is fit to whichever years of running sums are of interest. The median trend is referred to as either “lambda” or “alpha”. Lambda greater than 1.0 means that there’s at least a 50:50 chance that the population is increasing; lambda less than 1.0 means that it is declining.
Effect of Choosing Alternative Start Years On Median Lambda Estimate Effect of Choosing Alternative Start Years on Lambda Confidence Limits
How Data Sets Relate To Proposed Populations • Technical Recovery Teams (TRTs) have identified approximately 166 populations relevant to the 11 ESUs considered in analysis (SR sockeye, the 12th, was not evaluated) • At least one BRT data set was associated with 92 populations (55%). 139 data sets total, since sometimes >1 data set per population. • 1980-2001 “lambda” could be calculated for 83 of these data sets. Lack of hatchery fraction or incomplete time series were main reasons for inability to calculate “lambda” for other data sets.
Snake River Fall Chinook ESU 80% Effectiveness of Hatchery-Produced Wild Spawners: Lambda = 0.91 (0.77, 1.09) 20% Effectiveness of Hatchery-Produced Wild Spawners: Lambda = 1.01 (0.86, 1.17) NOTE: These numbers were reversed for 20% and 80% effectiveness in the Report to the Court. Also, I have heard that TAC has revised the 2001 wild fraction upwards - if so, these numbers will increase.