Download
1 / 67
670 likes | 688 Views
Explore the uncertainties in climate science and their implications for action. Learn about the different types of uncertainties and how scientists are addressing them.

E N D
Climate Change: The Move to Action(AOSS 480 // NRE 480) Richard B. Rood Cell: 301-526-8572 2525 Space Research Building (North Campus) rbrood@umich.edu http://aoss.engin.umich.edu/people/rbrood Winter 2012 February 9, 2012
Class News • Ctools site: AOSS_SNRE_480_001_W12 • 2008 and 2010 ClassOn Line: • http://climateknowledge.org/classes/index.php/Climate_Change:_The_Move_to_Action
The Current Climate (Released Monthly) • Climate Monitoring at National Climatic Data Center. • http://www.ncdc.noaa.gov/oa/ncdc.html • State of the Climate: Global • Plant Hardiness - 2012
Today • Uncertainty: Start of a Discussion • Projects • Observations of Physical Climate • Observations of Ecosystems
Uncertainty Discussion • How uncertain do you think climate science is? • What seems most uncertain to you? • Is this uncertainty small enough to motivate action, or is it so large that action is risky? • Is better communication of uncertainty what stands between us and doing something? • Is reducing uncertainty critical?
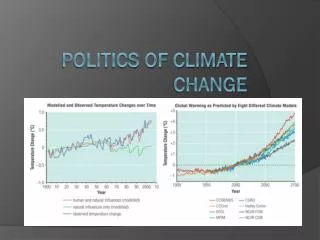
Note: There is consistency from many models, many scenarios, that there will be warming. (1.5 – 5.5 C) Also, it’s still going up in 2100! Basic physics of temperature increase is very simple, non-controversial. This represents the uncertainties in the observations
Academics and Scientists on Uncertainty • Lack of knowledge or imperfect knowledge • Two categories? • Aleatory: Dependent upon chance / randomness • Epistimic : Knowledge based / could be knowable
Academics and Scientists on Uncertainty • “Climate Scientists” • Value uncertainty • Structural uncertainty • Predictability
Academics and Scientists on Uncertainty • “Climate Scientists” through eyes of a model practitioner • Scientific goal to get answer for the right reason rather than get the right number • Sources of Uncertainty • Boundary conditions • Initial conditions • Structural formulation of physics • Parametric uncertainty • Numerical formulation • Downscaling and scaling noise
Academics and Scientists on Uncertainty • Rood in a DoE Strategy Document • Quantifying primary variable uncertainty (e.g., temperature) and integrated responses (e.g., sea-level rise) and presenting this information in a way suitable for risk analysis. • Addressing uncertainty related to biases and misrepresentation of the variability of multiscale, coupled processes and phenomena in climate models (e.g., mean state tropical biases and sea ice).
Academics and Scientists on Uncertainty • Rood in a DoE Strategy Document • Addressing uncertainty related to mechanisms and processes known to be missing from climate models (e.g., ice sheet models and groundwater flow). • Exploring uncertainty related to specification of emission scenarios and, more generally, human enterprise.
Some Uncertainty References • Climate Change Science Program, Synthesis Assessment Report, Uncertainty Best Practices Communicating, 2009 • Climate Change Science Program, Synthesis Assessment Report, Transportation Gulf Coast, 2008 • Moss and Schneider, Uncertainty Reporting, 2000 • Pidgeon and Fischhoff, Communicating Uncertainty, 2011 • Lemos and Rood, Uncertainty Fallacy, 2010
Some Project Ideas • Education • Strategies when policy requires teaching “denial” • Incorporation into engineering curriculum • Earth science in K-12; admission to college • Cities (esp Great Lakes) Adaptation • Climate in the Keystone Pipeline • Great Lakes • Seasonal forecast information / Long-term projections / Use of information / Effectiveness of communication efforts
Question • Madden and Ramanathan Predicted in 1980 would be discernable in 2000. • What would you do to evaluate the theory and predictions of global warming? • Surface of planet will warm • Sea level will rise • Weather will change • Think about • Measurements • Feedbacks • Correlative behavior • Impacts
The Elements of the Data System • Applications: Prediction and Hindcast • Objective evaluation of change • Alternative scenarios for climate forcings • How to use observations in prediction • Predictions for multi-member ensembles Research Satellite • Applications: Process Definition • - Definition of physical mechanisms • Use of observations to • define feedback mechanisms • - Reanalysis data sets Operational Satellite • Observation mission support • - Quality Control/Instrument Monitoring • Validation (linking different scales) • Definition of future observing system • Retrieval of geophysical parameters Conventional
Note: There is consistency from many models, many scenarios, that there will be warming. (1.5 – 5.5 C) Also, it’s still going up in 2100! Basic physics of temperature increase is very simple, non-controversial. This represents the uncertainties in the observations
The Current Climate • Climate Monitoring at National Climatic Data Center. • http://www.ncdc.noaa.gov/oa/ncdc.html • Global Analysis 2010 Annual Summary • Global Analysis December 2010 • Wunderground climate page
Central England Temperature • Central England Temperature from the Hadley Center
Note: It gets smoother away from the surface. IPCC Temperature Observations
20m Borehole Temperature Trends in Alaska 0 C ? Hinzman et al 2005
IPCC Water Vapor Observations Water Vapor Upper tropospheric temperature
IPCC Snow Cover Rood Blog 2 Rood Blog 3
Pasterze Glacier tongue: 1893-2001 From Paul Houser, George Mason University 2001 1893 1976 Changes of terminus position Austrian Alps Glaciers The Pasterze Glacier tongue receded ~1.2 km from 1893 to 2001 Glaciers in the European Alps have lost 50% of their volume in the last 150 years D. Hall/974
Remember Thermo-Haline Circulation • What was Haline? • Why was it important? • How might we change “halinity?” • Way 1? • Way 2?
Ocean Salinity (from R. Curry) Curry et al. Nature 2003
ERROR IN DATA IPCC Ocean Heat Content
Error in Ocean Data Set Ocean Cooling Correction • Outgoing Energy • Sea level rise • Direct comparisons with other observations
Some interesting facts • The old, incorrect data remain all over the web. • The correction of the observations is a routine aspect of quality control and scientific investigation • Often gets labeled as “manipulation.” • If data were left “uncorrected” then arguments that there are errors left in the data.
Ocean Heat Content • Initial work by Syd Levitus and colleagues showed an increase in the heat content of the oceans over the second half of the 20th century (Levitus et al., 2001, Science)
IPCC Sea Ice What is happening here?
Ice Shelf Collapse January 31, 2002 March 5, 2002
Some Icy Link • Snow and Ice Data Center • State of the Cryosphere
Correlated behavior of different parameters Fig. 2.5. (State of Climate 2009) Time series from a range of indicators that would be expected to correlate strongly with the surface record. Note that stratospheric cooling is an expected consequence of greenhouse gas increases. A version of this figure with full references is available at www.ncdc.noaa.gov/bams-state-of-climate/.
Today • Observations of Physical Climate • Observations of Ecosystems
Edges • “Edges” are places where we really might be able to see things definitively. What are the edges? • Ice (Phase transition) • Deserts • Seasons
There is an accumulation of observations • Physical and biological impacts correlated with temperature increase and dryer conditions. • What is the relationship between warming and surface dryness? • Strongly correlated with population and where we have looked.
Project Budburst • A community science activity collect observations of the onset of spring • Project Budburst • How to observe the onset of spring • National Phenology Network
Project of Trees • A community science activity to collect observations on types of trees • Canadian Plant Hardiness Site