Download
1 / 10
100 likes | 122 Views
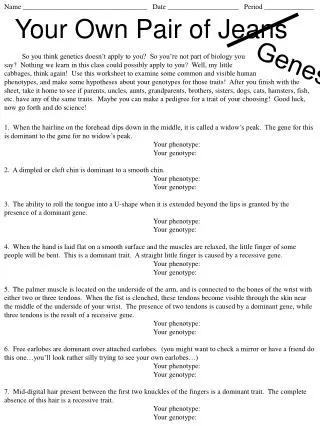
Name: Date: Period:. Topic : Patterns and Linear Functions Essential Question : How can you represent and describe functions?. Warm-Up :.

E N D
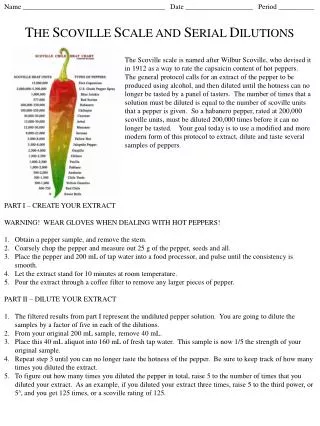
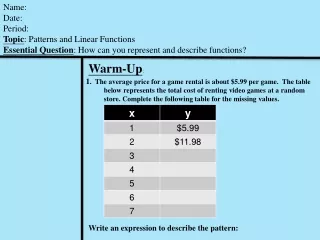
Name: Date: Period: Topic: Patterns and Linear Functions Essential Question: How can you represent and describe functions? Warm-Up: 1. The average price for a game rental is about $5.99 per game. The table below represents the total cost of renting video games at a random store. Complete the following table for the missing values. Write an expression to describe the pattern:
Complete the table below, identify the pattern, and write the appropriate expression.
Identify quantities in the pictures that vary in response to other quantities:
Vocabulary: • Independent Variable • Inputs (Domain) • Dependent Variable • Outputs (Range) • Functions is a variable that provides the input values of a function • the values of ‘x’ or independent variable is a variable that provides the output values of a function • the values of ‘y’ or dependent variable is a relation that assigns exactly one value in the range to each value of the domain. (No Value in the DOMAIN can be repeated) (3, 4), (5, 6), (7, 8) (3, 4), (3, 6), (7, 8) Not Yes
Vocabulary: Linear Functions a function whose graph is a nonvertical line. These are functions, but Non-linear functions
y Quick Graphing Review (Plotting Values) Page 243 (1) x
Work with a partner. Copy and complete each table for the sequence of similar rectangle. Graph the data in each table. Decide whether each pattern is linear or nonlinear.
Independent Practice: Page 243 Lesson Check (3 and 5)
34. 35. EOC Practice
Wrap-Up: Vocabulary Review Quarter 2-HLA#1: Hand-Out