Download
1 / 28
280 likes | 302 Views
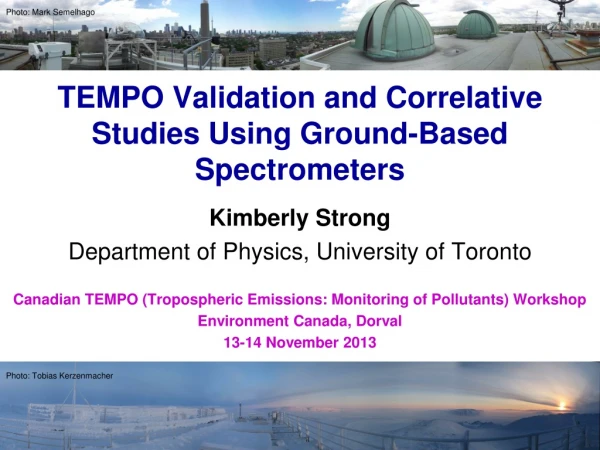
Photo: Tobias Kerzenmacher. Photo: Mark Semelhago. TEMPO Validation and Correlative Studies Using Ground-Based Spectrometers. Kimberly Strong Department of Physics, University of Toronto Canadian TEMPO (Tropospheric Emissions: Monitoring of Pollutants) Workshop Environment Canada, Dorval

E N D
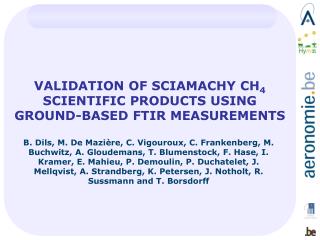
Photo: Tobias Kerzenmacher Photo: Mark Semelhago TEMPO Validation and Correlative Studies Using Ground-Based Spectrometers Kimberly Strong Department of Physics, University of Toronto Canadian TEMPO (Tropospheric Emissions: Monitoring of Pollutants) Workshop Environment Canada, Dorval 13-14 November 2013
Validation The Committee on Earth Observation Satellites (CEOS) Working Group on Calibration and Validation (WGCV) defines validation as: “the process of assessing, by independent means, the quality of the data products derived from system outputs” http://www.ceos.org/
Approaches to Validation Traditional approach • Obtain as many coincidences as possible with other data sets and perform statistical analysis of the differences. • Enables the quantification of biases and precision. • Need to define the coincidence threshold (in space and time), and determine whether it depends on season and location. • Need to assess the different representations of the atmosphere provided by the different measurements. Emerging approaches: do not rely on coincidences • Examine statistical properties of different measurements, such as variances and correlations. Assimilation of the validation data • Create a gridded data set of remapped validation data that can be used to assess and correct the model biases
TEMPO Validation Targets Standard Data Products: • O3, NO2, aerosol, cloud products • sampled hourly • H2CO,SO2, C2H2O2 • sampled 3 times per day Table from presentation by:
Ground-Based Measurements These provide: 1) A means of validating satellite observations and ‘pinning’ them to well-fixed values of the quantity being observed. 2) A method of bridging between various satellite instruments so that long-term trends can be maintained. 3) A means of obtaining high-resolution vertical data near the surface where satellite observations are limited. 4) A correlative dataset that can be combined with the satellite data to enhance the science. Global networks provide high temporal resolution but are irregularly spaced, with many regions unobserved.
UV-Vis and FTIR Spectroscopy • UV-visible spectrometers: • Air quality: O3, NO2, H2CO, SO2, C2H2O2 • Ozone chemistry:O3, NO2, BrO, OClO • Fourier transform infrared (FTIR) spectrometers: • Air quality: O3, CO, C2H2, C2H4, C2H6, HCN, H2CO, CH3OH • Ozone chemistry:O3, NO, NO2 (stratospheric), HNO3, ClONO2, HCl, ClO, CFCs • Greenhouse gases: H2O, CO2, CH4, N2O • Tracers and other gases: HF, SF6, NH3, HCOOH, CH3Cl
Global FTIR/UV-Visible Networks NDACC: Network for Detection of Atmospheric Composition Change TCCON: Total Carbon Column Observing Network https://tccon-wiki.caltech.edu/ www.ndacc.org Figure courtesy of ABB Figure courtesy of E. Sepúlveda, M. Schneider
Canadian Capabilities • Eureka has two portable UV-Visible spectrometers affiliated with NDACC • Eureka has FTIR spectrometers affiliated with all four networks and Toronto has an NDACC FTIR • There are seven more ground-based FTIR spectrometers in use or available for deployment in Canada • All nine FTIR instruments are being used to create the Canadian FTIR Observing Network (CAFTON) • Kim Strong (PI), Jim Drummond, Dylan Jones, John Lin, Kaley Walker, Pierre Fogal, Jacques Giroux, Richard Mittermeier • ABB is our industrial partner – six ABB instruments involved
The CAnadian FTir Observing Network (CAFTON) • A new pan-Canadian network to coordinate atmospheric measurements being made by nine FTIR spectrometers • University of Toronto Atmospheric Observatory (TAO), Toronto – DA8 • Dalhousie Atmospheric Observatory, Halifax – DA8 • Centre for Atmospheric Research Experiments (CARE), Egbert – DA8 • Polar Environment Atmospheric Research Laboratory (PEARL), Eureka – E-AERI, Bruker 125HR • A new site (TBD) in western Canada – DA8 and Bruker 125HR • Two portable instruments – the Portable Atmospheric Research Interferometric Spectrometer (PARIS-IR) and Bruker 125M • The measurements are being integrated with two atmospheric models (GEOS-Chem and STILT) to • Characterize atmospheric composition – focus on troposphere • Determine transport pathways • Identify pollutant sources CAFTON is a CSA FAST project,with four instruments from EC.
CAFTON Sites Eureka: PEARL New site (TBD) Halifax Egbert:CARE Toronto:TAO Map: http://wwp.greenwichmeantime.com/time-zone/north-america/canada/
U of T Atmospheric Observatory: TAO • 43.66N, 79.40 W, 174 m a.s.l. • Primary instrument: Bomem DA8 FTIR • Semi-automated daily measurements of solar mid-IR absorption spectra • Columns and vertical profiles retrieved • Operational since October 2001 • Additional instruments: • Brewer (on loan from EC since 2005), weather station • On campaign basis: SAOZ (LATMOS), UV-visible spectrometer, PARIS-IR • Data have been used for validation of: • SCIAMACHY, OSIRIS, ACE-MAESTRO, and ACE-FTS, including O3 and NO2 Wiacek et al., GRL 2006; JAOTech 2007; JQSRT 2008; Taylor et al., CJP 2007; JQSRT 2008; Wunch et al., ACP 2007; Whaley et al., JGR 2013 Photo: Cyndi Whaley
HCl(pc=12-50km) A Decade of TAO Measurements HF(pc=12-50km) Total column Partial column Partial column (0-12 km, O3) N2O(pc=12-50km) O3(pc=12-50km) C2H6(pc=0-5km) Aldona Wiacek, Jeff Taylor, Cyndi Whaley, Ilya Stanevich, Stephanie Conway, Orfeo Colebatch and many others Plot: Mark Semelhago CH4 CO(pc=0-10km)
ACE-FTS & MAESTRO NO2:Kerzenmacher et al., ACP 2008 ACE-FTS N2O:Strong et al., ACP 2008 SCIAMACHY CO: Dils et al., ACP 2006 OSIRIS NO2: Taylor et al., CJP 2007
TAO & CARE Tropospheric Columns Lower trop. O3 columns are of the same magnitude at both locations. Lower trop. CO columns are 19% 6% greater in Toronto. Consistent with larger fossil fuel emissions in the city. TAO (urban) CARE (rural) 0-3 km CO Cyndi Whaley 0-5 km O3
CO: Fossil Fuel Sources Using GEOS-Chem Winter 2005 • Using GEOS-Chem CTM to interpret short-term variability and to identify and quantify isources of air pollution. The tagged fossil fuel sources for Toronto Cyndi Whaley, Dylan Jones
TAO C2H2, HCOOH and H2CO • Using TAO FTIR measurements to optimize retrievals of acetylene, formic acid, formaldehyde and methanol • Implementing the Stochastic Time-Inverted Lagrangian Transport (STILT) model to derive upstreaminfluence regions on TAO measurements Ilya Stanevich
The PEARL at Eureka • Polar Environment Atmospheric Research Laboratory • Formerly Env. Canada’s Arctic Stratospheric Ozone Observatory • Team led by PI Jim Drummond • ~20 instruments at three facilities, 80N, 86W, 610m a.s.l. • 2005-2012 – CANDAC • Four themes: • Arctic Troposphere Transport and Air Quality • The Arctic Radiative Environment: Impacts of Clouds, Aerosols, and “Diamond Dust” • Arctic Middle Atmosphere Chemistry • Waves and Coupling Processes • 2003-2018 – PAHA (Probing the Atmosphere of the High Arctic) • Three themes: • Composition Measurements • Polar Night • Satellite Validation
PEARL FTIR: Bruker 125HR • FTIR installed July 2006 • Replaced EC Bomem DA8, which was removed in 2009 • Semi-automated daily solar IR absorption measurements • Late February to late October • Vertical profiles and columns • O3, NO, NO2, HNO3, ClONO2, HCl, HF, N2O, CFCs, CO, CH4, C2H6, HCN, OCS, ... • Data used for validation of: • ACE-FTS, ACE-MAESTRO, GOSAT, OSIRIS, including O3 and NO2 Batchelor et al., JAOTech 2009; AMT 2010; Lindenmaier et al., JQSRT 2010; JGR 2011, ACP 2012; Viatte et al., Atmos-Ocean 2013
PEARL FTIR Time Series: 2006-2011 Ozone HCl (chlorinereservoir) HF (tracer) HNO3 (nitrogenreservoir) ClONO2 (chlorinereservoir) N2O (GHG) CO(biomass burning) CH4 (GHG) The first five years of PEARL Bruker FTIR data. This extends the 1993-2008 springtime dataset acquired by Environment Canada’s Bomem DA8 FTIR (H. Fast, R. Mittermeier) Rodica Lindenmaier
ACE-FTS O3, HCl, HF, HNO3, ClONO2: Batchelor et al., AMT 2010 ACE-FTS O3: Lindenmaier et al., JQSRT 2010 GOSAT XCH4: Yoshida et al., AMT 2013 GOSAT XCO2: Wunch et al., AMT 2011
Sources of Pollution in the Arctic • The Arctic is a major receptor for mid-latitude pollution, including biomass burning and fossil fuel emissions • Combining our measurements with GEOS-Chem to identify sources BiomassBurning Fossil Fuels 11/07 02/04 22/05 30/08 02/04 22/05 11/07 30/08 Camille Viatte, Dylan Jones
August 2010 Event at PEARL CO, HCN and C2H6 columns 23 August IASI CO CO and AOD Viatte et al., Atmosphere-Ocean 2013
Tracking the Origin of August 2010 Event • Russian wildfires covered ~5M hectares by early August 2010 • Smoke extended over about 3,000 km (E to W) and sometimes reached altitudes of 12 km • Plumes from fires on August 15 arrived at PEARL on August 24 • HYSPLIT back-trajectories • Back-trajectories on Google map • MODIS fire image • OMI aerosol index Viatte et al., Atmosphere-Ocean 2013
1999 2001 2008 2006 2006 UV-Vis: UT-GBS & PEARL-GBS • PEARL-GBS (Ground-Based Spectrometer) installed 2006 • Side-by-side with UT-GBS (spring campaigns since 1999) • Daily automated measurements until polar sunset • Scattered sunlight, direct-sun, and MAX-DOAS in UV-visible • O3, NO2, BrO, OClO columns • Also spring SAOZ measurements 2005-2013(F. Goutail, A. Pazmino) UT-GBS PEARL-GBS Fraser et al., ACP 2008, JQSRT 2009; Adams et al., JGR 2010; GRL 2012, AMT 2012, ACP 2013
PEARL UV-Vis Time Series: 2006-11 Ozone total columns • Ozone annual variability dominated by Brewer-Dobson circulation • Spring variability related to the polar vortex • NO2 seasonal variation due to release of night-time reservoirs NO2 total columns Polar night Cristen Adams, Xiaoyi Zhao
ACE-FTS and ACE-MAESTRO O3: Fraser et al., ACP 2008 ACE-FTS, ACE-MAESTRO, and OSIRIS NO2: Adams et al., AMT 2012
Concluding Remarks • UV-visible and FTIR spectrometers at Toronto and Eureka have contributed to the validation of measurements by ACE-FTS, ACE-MAESTRO, OSIRIS, and other satellite instruments • They have also been used to investigate polar air intrusions, sources and transport of pollutants, stratospheric ozone depletion, biomass burning, the radiation budget, water vapour, and greenhouse gases • Of particular relevance to TEMPO are sites in the new Canadian Fourier Transform InfraRed Observing Network (CAFTON), particularly those at mid-latitudes (Toronto, Halifax, Egbert, new site in western Canada), and two portable instruments • If still operational in 2018-2019, they will provide a dataset that can be used for validation of the TEMPO data products • FTIR spectrometers can be used to validate TEMPO O3 and H2CO • Would like to deploy new UV-Vis spectrometers at our sites (similar to those at Eureka) for validation measurements of O3, NO2, H2CO, SO2, and C2H2O2 • The FTIR spectrometers will also provide a suite of related trace gases (e.g., N2O, CH4, CO, C2H6, C2H2, HCN) that can provide context for the TEMPO data products and be used for correlative scientific studies
Clive Midwinter Acknowledgements CAFTON • Canadian Space Agency, Environment Canada TAO • NSERC, CSA, EC • CFI, ORDCF, CRESTech, UToronto, NSERC, ABB Bomem, CFCAS, PREA • The many interns, students and postdocs who have made measurements The CARE DA8 was operated by Environment Canada PEARL/CANDAC(see http://www.candac.ca) • ARIF, AIF/NSRIT, CFCAS, CFI, CSA, EC, GOC-IPY, INAC, MRI, MSC, NSERC, NSTP, OIT, ORF, PCSP, SEARCH • PI Jim Drummond, site manager Pierre Fogal ACE Arctic Validation Campaigns (see http://acebox.uwaterloo.ca/eureka/) • CSA, EC, NSERC, NSTP • Co-PI Kaley Walker Logistical and operational support at Eureka • The wonderful team at the EC Weather Station • The CANDAC operators