Download
1 / 20
200 likes | 307 Views
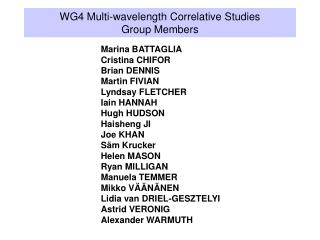
WG4 Multi-wavelength Correlative Studies Group Members. Marina BATTAGLIA Cristina CHIFOR Brian DENNIS Martin FIVIAN Lyndsay FLETCHER Iain HANNAH Hugh HUDSON Haisheng JI Joe KHAN Säm Krucker Helen MASON Ryan MILLIGAN Manuela TEMMER Mikko VÄÄNÄNEN Lidia van DRIEL-GESZTELYI

E N D
WG4 Multi-wavelength Correlative StudiesGroup Members Marina BATTAGLIA Cristina CHIFOR Brian DENNIS Martin FIVIAN Lyndsay FLETCHER Iain HANNAH Hugh HUDSON Haisheng JI Joe KHAN Säm Krucker Helen MASON Ryan MILLIGAN Manuela TEMMERMikko VÄÄNÄNEN Lidia van DRIEL-GESZTELYI Astrid VERONIG Alexander WARMUTH
RHESSI WG4 – SCHEDULE Wednesday 11:00 – 13:00 RHESSI Thermal / low energy / multi-l spectroscopy 14:30 – 18:00 Footpoints Part I Thursday 09:00 – 10:30 Coronal sources, joint with WG3 11:00 – 13:00 Footpoints Part II 14:30 – 16:00 Joint session with WG2 – Oct 28th event 16:30 – 18:00 Joint with WG5 – soft-hard-soft, number problem, etc. Friday 09:30 – 11:00 Energetics
RHESSI Observations of the Iron-Line Feature • From Fe line complex at 6.7keV, compared to continuum we have a handle on the Fe/H abundance ratio. • How does the empirical Fe/H abundance ratio in flares vary with Te ? • How do empirical correlation curves compare with theoretical curves calculated with coronal Fe abundances ? • Survey of ~ 30 RHESSI flares (C3 - X5) • Fe line features observed by RHESSI at 6.7 keV indicate a coronal abundance of Fe Discrepancies could be due to: instrumental effects, non-isothermality errors in atomic rates CHIFOR/PHILLIPS/DENNIS
RHESSI Quiet Sun Offpointing Offpoint RHESSI from Sun to modulate QS signal and separate from background: noise limited or signal ? • ~667hrs off sun (so far), 127hrs useful (20%), 63hrs<A1(9.5% • So far, have observed Quiet Sun with hot coronal loops in SXI/EIT • New limits in 3-17 keV • correlates with GOES in 3-7 keV QS signal detected? • Fit Hot T, low EM (5-7MK, 1044cm3) or steep power-law (<-7) • Comparable limits 17-100 keV • What will we get with more offpointing during Solar minimum? HANNAH
DEM exp(-T/T0) PINT-of-ALE DEM • Multi-instrument DEM • Ten RHESSI bins from 5 – 12 keV • Two GOES channels • Markov-Chain Monte Carlo method uncertainties (colour bars) returned by MCMC analysis DENNIS/LI
Inter-instrument calibration: XSM+RHESSI XSM/RHESSI spectrum XSM/RHESSI lightcurve 6-8kev • XSM GOES calibrations OK • XSM/RHESSI low E needs factors explained • Messenger/XSM underway VÄÄNÄNEN/DENNIS
Propagating Brightenings Following Filament Eruptions Brightenings parallel to flare ribbons were observed with RHESSI (Grigis + Benz) Survey of brightenings associates with erupting filaments in EIT shows many examples of brightenings along arcade footpoints Slow speeds correspond to slow eruptions MASON/TRIPATHI
RHESSI-SOHO/CDS Observations of Chromospheric Evaporation Plasma velocities observed with CDS during impulsive phase of 2 flares • A high flux of non-thermal electrons high-velocity upflows and low-velocity downflows (explosive evaporation) • A flux value an order of magnitude lower weaker upflows and no downflows (gentle evaporation) MILLIGAN
Constraints from the magnetic field on HXR source motions (17-Jan-2005 X3.8 flare) RHESSI HXR sources occur only along certain parts of the Ha ribbon edges Higher local reconnection rates (factor 5-10) at these sites HXR sources tend to avoid strongest magnetic fields and umbrae. Almost vertical inclination of field lines does not favour reconnection there? Peculiar motions/spatial jumps of HXR sources? Reconnection rises through field lines of lines of different altitudes, with distant footpoint locations TEMMER
July 23, 2002 Correlation of FP Motion with Deposited Energy • 2-d model, sheet of area Ar • Ar = Lh∙Lv= area of reconn. region • Correlation of Deposited Energy with Footpoint Separation • a = acceleration efficiency • Smooth correlation curve ‘accurate’ (=stable) FP positions and fits of spectra • Can derive the required current sheet vertical extent, Lv LV 25 arcsec LV huge LV 100 arcsec FIVIAN
Footpoint motions and flare shear Red contour: 30-50 keV Blue contour: 3-10 keV Green contour: 34GHz The distance and velocity between the two Ha kernels The distance between the two HXR FPs The ‘height’ of the HXR loop top source The flare shear time profile The rate of change of flare shear JI
Coronal Sources in an occulted solar flare: 20-Jul-2002 100-200keV 50-100keV 20-30keV • Hard spectral index ~3.0 • GOES+RHESSI gives density estimate of 2.2x1011cm-3. • Column depth will collisionally stop electrons with 30-40keV • How does > 100keV emission arise? BONE
Flux – Spectral Index correlations in coronal sources RHESSI imaging - spectroscopy finds soft-hard-soft behavior in the coronal source of several flares might be a feature of the accelerator and not a transport effect Time evolution of spectral index and non-thermal flux at 35 keV of coronal hard X-ray spectra BATTAGLIA/BENZ
Relativistic Shock Drift Acceleration (SDA) at the Reconnection Outflow Termination Shock (TS) • theory: fast-mode standing shock in reconnection outflow • radio observations: signatures of TS are present • theory: relativistic shock drift acceleration at the TS • comparison of theory and observations: SDA at the TS can reproduce required electron fluxes & power WARMUTH/MANN/AURASS
Moreton wave in Radio Is the ‘termination shock’ suggested by Warmuth et al a standing shock at all? Moreton/coronal wave seen in radio Dotted line: Edge of Ha Moreton wave PICK
WG 4+5 Flux – spectral index correlation (“SHS”) – presentation by Grigis on a transit-time damping model Electron total numbers, fluxes, and predicted/observed response of atmosphere – discussion by all Presentation by Pick on Type III bursts associated with compressing edge of a CME – new theoretical challenge (see Steven’s presentation)
Rising Coronal X-ray Source and Erupting Filament pos i t i on Fe XIX Doppler velocity SOHO/CDS slit Flux rope Vl<0 + Vl>0 Cooling loops time • • RHESSI coronal source at constant distance beneath filament – RHESSI source as result of interaction of upwards outflow jets with filament? • CDS observations with slit above a rising filament + magnetic field extrapolations • downflows of hot plasma along flare loop legs • • Rapid motion of filament into LASCO FOV implies exponential growth of CMEs in the low corona van Driel/Goff et al
Flare energetics • Total radiated energy in SXR (LSXR) from GOES • Total radiated energy from hot plasma (Lhot) from GOES T & EM. • Total radiated energy from SORCE (Ltotal) • CME KE from LASCO • Ltotal ~KECME • ~ 10 Lhot • ~ 100 LSXR DENNIS
White Light Flares and Energetics 1 px = 0.5” ~ 300km Orange=25-50keV Blue=WL • Very compact sources • Correlated in time and space with HXRs at 10s of keV • Provide an independent diagnostic for energy deposited in atmosphere • Same order of magnitude as electron energy flux inferred from HXR thick target HUDSON/FLETCHER