Download

1 / 25
250 likes | 327 Views
Explore the latest remote sensing technologies and data to study ocean carbon stocks, fluxes, and communities for a better understanding of Earth's carbon cycle. Learn about innovative approaches in satellite observations and their implications for ocean research. Join the discussion on advancing our knowledge of the ocean's carbon dynamics through remote sensing.

E N D
Reenvisioning the Ocean: The View from SpaceA RESPONSE Dave Siegel University of California, Santa Barbara
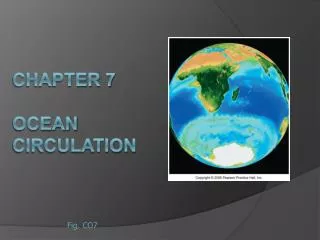
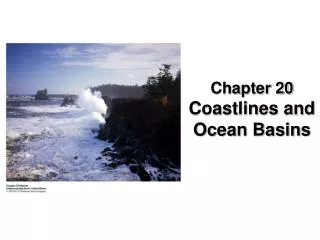
6 12.011 C Carbon
Remote Sensing Carbon • Stocks • pCO2, DIC, DOC, POC & PIC • Components • Community structure, calcifiers, N2 fixers, etc. • Fluxes • Air-sea, export, net community production, etc.
Remote Sensing Carbon • Ocean color is not perfect for this task Optical properties are not carbon species CDOM is not DOC, optical backscattering is not POC • Need to think like paleo-oceanographers… Develop “quantitative proxies” But … test them using real observations
Some Examples… • Stocks • POC • pCO2 • CDOM (This is a shameless plug for our CDOM poster!!) • Components • Calcifiers - coccolithophorid bloom occurrence • Fluxes • Air-sea CO2 fluxes
Remote Sensing of POC April 1998 Relate POC to estimates of optical backscattering by particle Loisel et al. [2002] GRL
Remote Sensing of POC April 1998 SeaWiFS chlorophyll concentration SeaWiFS POC
Remote Sensing of POC “POC” Chlorophyll Average for the North Atlantic (0 to 60oN)
Remote Sensing of POC • POC patterns are very different from chlorophyll • Validation at BATS & HOT is OK, but not great • Ratios of satellite to field POC are 1.22 (± 0.37) @ BATS & 0.94 (±0.27) @ HOT • Enables POC budgets to be assessed • Mean POC = 54 mg C m-3 • Large uncertainty in conversion from optics to POC • Estimated to be ~40% - Improvements are underway
Remote Sensing of Calcifiers Coccolithophorid bloom classification Iglesias-Rodríguez et al. [2002] GBC
Remotely Sensing of Calcifiers • Classification analysis based on observations of coccolithophorid blooms • Enables space/time characteristics of coccolithophorid blooms to be assessed • First (& probably easiest) step towards determining phytoplankton community structure remotely
Air-Sea CO2 Fluxes • Relate observations of pCO2 to SST • Satellite SST to map pCO2 • Highly variable relationship Lee et al. [1998] Nature
Air-Sea CO2 Fluxes Incorporating winds enables air-sea CO2 fluxes to be estimated
Air-Sea CO2 Fluxes • Used regional relationships for pCO2 as f(SST) • Drive with remote estimates of wind & SST • Approach has promise, but we need a better way to predict pCO2 • What if climate change, alters pCO2 =f(SST)??
6 12.011 C Carbon
Remote Sensing Carbon • Ocean color is not easily related to carbon • Chlorophyll is not carbon • Key is using “real” observations to build simple models • Global data are finally available – more in future • The JGOFS legacy is its open data access • We are really just at the beginning of this work
The Future is Remotely Sensible • There are many applications under consideration • Primary production & export fluxes • Photochemical rxn rates (CO, CO2, COS, etc.) • DMSP/DMS cycling & air-sea DMS fluxes • Trichodesmium distributions • Physiological status from fluorescence • and many more …
Remote Sensing of DOC Colored Detrital & Dissolved Organic Material Absorption Siegel et al. [2002] JGR
Remote Sensing of DOC NH Winter DOC Distribution Siegel et al. [2002] JGR
Remote Sensing of Trichodesmium Index for Trichodesmium occurrence Toby Westberry [work in progress]
Remote Sensing of DIC & pCO2 • Empirical approach for the Tropical Pacific • Model … DIC = f(SST,SSS) TA = f(SST,SSS) Loukos et al [2000] GRL Fall ‘92 Spring ’92 DIC pCO2
DpCO2 GasEx Flux Remote Sensing of DIC & pCO2 • Average from 5oS to 10oN • 1982 to 1994 • SST, SSS & wind products used
Remote Sensing of DIC & pCO2 SOI Anomalous evasion is well related to SOI
Remote Sensing of DIC & pCO2 • Empirically model DIC & TA for Tropical Pacific • Drive this with remote sensing (& other) data • Find relationship between CO2 evasion & SOI • BUT, evasion flux uncertainties are ~50% • More field observations should help • So would the remote sensing of sea surface salinity