Download
1 / 77
810 likes | 1.13k Views
Economic Growth, Business Cycles, Unemployment, and Inflation. Chapter 6. Laugher Curve. An Indian-born economist once explained his personal theory of reincarnation to his graduate economics class. Laugher Curve.

E N D
Economic Growth, Business Cycles, Unemployment, and Inflation Chapter 6
Laugher Curve An Indian-born economist once explained his personal theory of reincarnation to his graduate economics class.
Laugher Curve “If you are a good economist, a virtuous economist,” he said, “you are reborn as a physicist.” “But if you are an evil, wicked economist, you are reborn as a sociologist.”
Introduction • Macroeconomics is the study of the aggregate moods of the economy. • The four central problems are growth, business cycles, unemployment, and inflation.
Two Frameworks: The Long Run and the Short Run • Issues of growth are considered in a long-run framework. • Business cycles are generally considered in a short-run framework. • Inflation and unemployment fall within both frameworks.
Growth • The primary measurement of growth is changes in real gross domestic product. • Real gross domestic product (realGDP) – the market value of goods and services stated in the prices of a given year.
Growth • The U.S. secular growth rate is between 2.5 to 3.5 percent per year.
Growth • Per capita real output growth has been 2.5 to 3.5 percent per year. • Per capita real output is real GDP divided by the total population.
Global Experience with Growth • Today's growth rates are high by historical standards. • The range of growth rates among nations is wide. • African countries have consistently grown below the world average.
Global Experience with Growth • The growth trend we now take for granted started at the end of the of the18th century. • At about the same time, markets and democracies became the primary organizing structures of society.
The Benefits and Costs of Growth • Per capita economic growth allows everyone in society, on average to have more. • Growth, or predictions of growth, allows governments to avoid hard questions.
The Benefits and Costs of Growth • The costs of growth include pollution, resource exhaustion, and destruction of natural habitat.
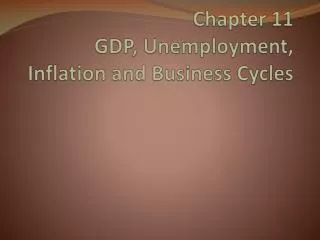
Business Cycles • The business cycle is the upward and downward movement of economic activity that occurs around the growth trend.
Business Cycles • There are a number of policies regarding business cycles. • Classical economists generally favor laissez-faire or noninterventionist policies. • Keynesians generally favor activist policies.
20 10 0 –10 –20 1860 ‘70 ‘80 ‘90 1900 ‘10 ‘20 ‘30 ‘40 ‘50 ‘60 ‘70 ‘80 ‘90 2000 ‘10 U. S. Business Cycles World War II World War I Recovery of 1895 Civil War Korean War Vietnam War Panic of 1893 Panic of 1907 Great Depression McGraw-Hill/Irwin © 2004 The McGraw-Hill Companies, Inc., All Rights Reserved.
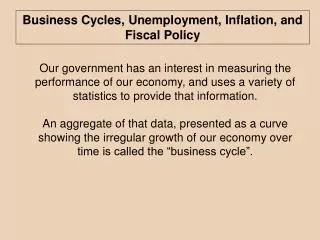
The Phases of the Business Cycle • The peak is the top of the business cycle. • A boom is a very high peak, representing a big jump in output. • The downturn is the phenomenon of economic activity starting to fall from a peak.
The Phases of the Business Cycle • A recession is a decline in output that persists for more than two consecutive quarters in a year. • A depressionis a large recession. • A trough is the bottom of the recession or depression.
The Phases of the Business Cycle • An expansion is an upturn that lasts at least two consecutive quarters of a year.
Expansion Recession Expansion Boom Peak Upturn Downturn Total Output Secular growth trend Trough 0 Jan.- Mar Apr.- June July- Sept. Oct.- Dec. Jan.- Mar Apr.- June July- Sept. Oct.- Dec. Jan.- Mar Apr.- June The Phases of the Business Cycle McGraw-Hill/Irwin © 2004 The McGraw-Hill Companies, Inc., All Rights Reserved.
Recessions and expansions are caused primarily by demand-side of the economy. A debate exists about whether these fluctuations can and should be reduced. Why Do Business Cycles Occur
Most economists believe that potential depressions should be offset by economic policy. Why Do Business Cycles Occur
Since the late 1940s, compared to prior years: Why Do Business Cycles Occur • Downturns and panics have generally been less severe. • The duration of business cycles has increased. • The average length of expansions has increased while the average length of contractions has decreased.
Most economists believe that business fluctuations have become less severe because of the stronger role of government in the economy. Why Do Business Cycles Occur
Leading Indicators • Leading indicators tell us what's likely to happen in the economy 12 to 15 months from now.
Leading Indicators • Leading indicators include the following: • Average workweek for production workers in manufacturing. • Unemployment claims. • New orders for consumer goods and materials.
Leading Indicators • Leading indicators include the following: • Vendor performance, measured as a percentage of companies reporting slower deliveries from suppliers. • Index of consumer expectations. • New orders for plant and equipment.
Leading Indicators • Leading indicators include the following: • Number of new building permits issued for private housing units. • Change in stock prices. • Interest rate spread. • Changes in the money supply.
Unemployment • The unemployment rate is the number of people who are willing and able to work but are not working.
Unemployment • Cyclical unemployment is that which results from fluctuations in economic activity. • Structural unemployment is that caused by economic restructuring making some skills obsolete.
Unemployment as a Social Problem • The Industrial Revolution created the possibility of cyclical unemployment. • It brought a change in how families dealt with unemployment. • What had previously been a family problem, became a social problem.
Unemployment as Government’s Problem • As capitalism evolved, capitalist societies no longer saw the fear of hunger as an acceptable answer to unemployment.
Unemployment as Government’s Problem • Full employment – an economic climate in which just about everyone who wants a job can have one.
Unemployment as Government’s Problem • Frictional unemployment is the unemployment caused by: • New entrants into the job market, and • People quitting a job just long enough to look for and find another one.
Unemployment as Government’s Problem • The target rate of unemployment is the lowest sustainable rate of unemployment that policymakers believe is achievable under existing conditions. • It is sometimes called the natural rate of unemployment.
Unemployment as Government’s Problem • In the 1980s and 1990s, the target rate of unemployment was been between 5 and 7 percent. • Today, the target rate of unemployment is about 5 percent.
Why the Target Rate of Unemployment Changed • In the 1970s and early 1980s, a low inflation rate seemed to be incompatible with a low unemployment rate. • Demographics have changed – different age groups have different rates of unemployment.
Why the Target Rate of Unemployment Changed • Social and institutional structures have changed. • Governmental institutions also changed.
Whose Responsibility Is Unemployment? • Classical economists believe that individuals are responsible for their own jobs. • Keynesian economists tend to say that society owes people jobs commensurate with their training or past job experience.
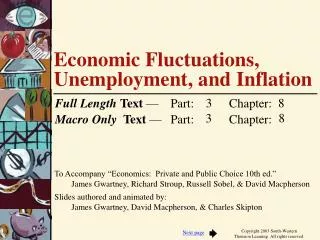
How Is Unemployment Measured? • The unemployment rate is published by the U.S. Department of Labor's Bureau of labor Statistics.
30 20 10 0 1910 1920 1930 1940 1950 1960 1970 1980 1990 2000 2010 Unemployment Rate Since 1900 Target rate McGraw-Hill/Irwin © 2004 The McGraw-Hill Companies, Inc., All Rights Reserved.
Calculating the Unemployment Rate • The unemployment rate – the number of unemployed individuals divided by the number of people in the civilian labor force then multiplied by 100.
Calculating the Unemployment Rate • The labor force – those people in an economy who are willing and able to work. • The labor force excludes those incapable of working and those not looking for work.
Total civilian population (288.4 million) Noninstitutional population (214.0 million) Incapable of working (74.4 million) Labor force (142.5 million) Not in labor force (71.4 million) Employed (134.3 million) Unemployed (8.3 million) Unemployment/Employment Figures (in millions) McGraw-Hill/Irwin © 2004 The McGraw-Hill Companies, Inc., All Rights Reserved.
How Accurate Is the Official Unemployment Rate? • The unemployment rate does not include discouraged workers. • Discouraged workers –people who do not look for a job because they feel they do not have a chance of getting one.
How Accurate Is the Official Unemployment Rate? • The unemployment rate counts as employed those who are underemployed. • Underemployed –part-time workers who would prefer full-time work.
How Accurate Is the Official Unemployment Rate? • The unemployment rate includes as unemployed, people who say they are looking for a job who are really not. • Many are “working off the books, others are vacationing.
How Accurate Is the Official Unemployment Rate? • The Bureau of Labor Statistics uses the labor force participation rate and the employment rate to gauge the state of the labor market.
How Accurate Is the Official Unemployment Rate? • The labor force participation rate measures the labor force as a percentage of the total population at least 16 years old. • The employment rate measures the number of people who are working as a percentage of the labor force.
Unemployment and Potential Output • The capacity utilization rate indicates how much capital is available for economic growth. • Capacity utilization rate – the rate at which factories and machines are operating compared to the maximum sustainable rate at which they could be used.
Unemployment and Potential Output • Potential output – output that would be achieved at the target rates of unemployment and of capacity utilization.