Download
1 / 14
140 likes | 251 Views
Observations and Predictions of Ripple Development on a Complex Shoreface. Arthur C. Trembanis 1 , L. Donelson Wright 1 , Carl T. Friedrichs 1 , Malcolm O. Green 2 , Terry M. Hume 2. 1 Virginia Institute of Marine Science, College of William and Mary, Supported by the

E N D
Observations and Predictions of Ripple Development on a Complex Shoreface Arthur C. Trembanis1, L. Donelson Wright1, Carl T. Friedrichs1, Malcolm O. Green2, Terry M. Hume2 1Virginia Institute of Marine Science, College of William and Mary, Supported by the National Science Foundation INT-9987936 2National Institute of Water and Atmospheric Research, New Zealand Supported by the NZ Foundation for Research Science and Technology FRST-CO1X0015
Questions Addressed A field study of the effects of spatially varying substrates on bedform evolution was conducted on a shoreface on the east coast of New Zealand’s North Island under similar physical forcing conditions that included two significant storm events. • How do complex substrates differ from uniform substrates in terms of bedform dynamics? • How do bedforms on contrasting substrates vary in space and time? • How well do existing models account for those differences?
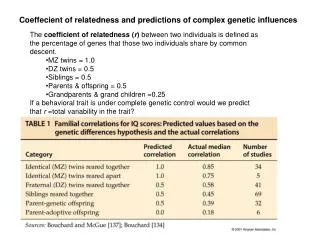
Main Points • Rough areas composed of large ripples sharply contacted smooth surfaces covered by fine sand. • The two facies types maintained their positions despite highly energetic conditions over a seven-month period. • Wave orbital ripples were the dominant roughness feature. • Roughness gradients were enhanced during storms. • The Nielsen model predicted the small ripples observed at the smooth site. Wikramanayake model had the best fit to the ripples at the rough site.
Study Area 900KHz 20m range Facies H (m) D50 (mm) s (cm/s) cr (dyn/cm)^2 Coarse 22 0.75 8.7 3.8 Fine 16 0.20 1.6 1.70 = 0.86º Not exact scale
Instrumented Benthic Tripod Surface Buoy Extension arm Steel Frame Batteries Data logger OBS EMCM 2.7 m ADCP CTD ADV ABS Sediment trap
Observed Hydrodynamics TC Paula Ts Period (s) Period (s) Period (s) Speed (cm/s) Speed (cm/s) Uorb Uc Date h = 22 m z = 0.70 mab Speed (cm/s)
Observed Bedforms Smooth Site = 5-8 cm = 20-30 cm Rough Site = 15-25 cm = 75-120 cm 900 kHz
Comparison of Bed Activity Altimetry records from contrasting sites Rough Elevation (cm) Smooth Diver Observations =15-25 cm =75-120 cm =5-8 cm =20-30 cm Rough Smooth
Roughness from Ripple Models Grain Size and wave parameters used in two ripple models to estimate roughness length Nielsen, P., 1981. J. Geophys. Res. 86 Wikramanayake,P.N., 1993., MIT
Ripple length Ripple height Height (cm) Length (cm) Model Results- Rough Site Nielsen, 1981 Sidescan Sonar/Diver Observations =15-25 cm =75-110 cm
Ripple Length Ripple length Ripple height Height (cm) Length (cm) Ripple Height Model Results- Smooth Site Nielsen, 1981 Sidescan Sonar/Diver Observations =5-8 cm =20-30 cm
Comparison of Ripple Model Results Rough Site Height 0.2 Wikramanayake Nielsen Height (m) 0.1 0.0 Smooth Site Height 0.1 Nielsen Height (m) 0.05 Wikramanayake 0.0 Date
Bed Roughness Comparison- Two sites Roughness length (m) 0.2 Rough Roughness Length (m) 0.1 Smooth 0.0
Conclusions • Spatial gradient in roughness between facies types is strong and persistent • Roughness gradient enhanced during storms • Smooth site experiences greater bed mobility • Two widely used ripple models tested against field data • No single model captured behavior at both sites • Nielsen model fairly well predicted ripple height and length at smooth site • Wikramanayake had a better fit to ripple height and length at rough site