Download
1 / 66
660 likes | 856 Views
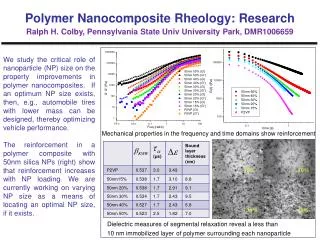
Intensity, Frequency and Relaxation time in the CH stretch overtones. Brant Billinghurst. Summary. CH Overtone Intensities: TMA and DMS Structural information from CH overtones: Metallocenes ICL-PARPS: A instrument for determining the V-T relaxation of Overtone Vibration.

E N D
Intensity, Frequency and Relaxation time in the CH stretch overtones Brant Billinghurst
Summary • CH Overtone Intensities: TMA and DMS • Structural information from CH overtones: Metallocenes • ICL-PARPS: A instrument for determining the V-T relaxation of Overtone Vibration
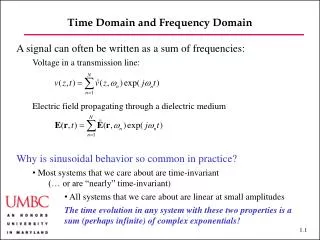
CH-Stretch Overtone Study of Trimethyl amine and Dimethyl Sulfide • Lone pair trans effect on TMA and DMS: • Different CH bond lengths in methyl group • Different CH stretching frequencies • Different intensities • Project goals: • Measure the experimental intensities • Compare with prediction of the (HCAO)LM model
Geometries Gauche: 1.0823 Å Trans: 1.0832 Å Gauche: 1.0847 Å Trans: 1.0956 Å
HCAO/LM Model • Calculations: H. G. Kjaergaard and G. Low • The Hamiltonian: 3 Morse oscillators • Dipole moment function from Grid • LM parameters from Birge-Spöner plots • No coupling between methyl groups
Experimental • The 1st through 4th overtones of • Trimethyl amine d0,d3,d6,d8,and d9 • Dimethyl Sulfide • All spectra: • Collected on a Nicolet 870 FT-IR • With a 10 m Gas cell • Curve fit analysis was done for the second through fourth overtones • Win-IR software was used for all curve fitting • In all cases correlation (R2) better then .99 was achieved
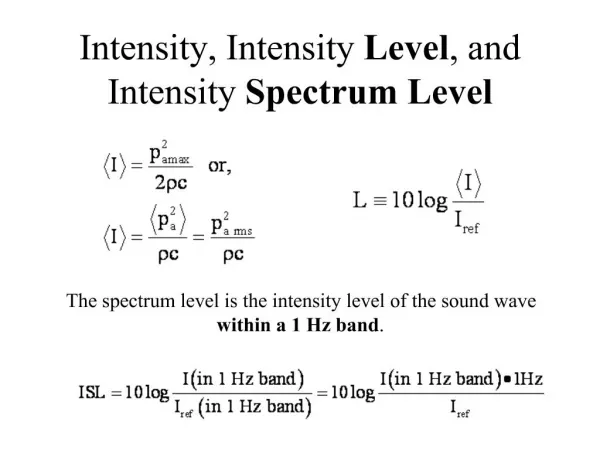
Relative Intensities • Intensities: % of given overtone region • For this discussion • Intensities are reported on a per bond basis • L-L intensities given as a single value
Comparison of the Second Overtone intensities of Trimethyl amine d0,d3,d6
Comparison of the Third Overtone intensities of Trimethyl amine d0,d3,d6
Comparison of the Fourth Overtone intensities of Trimethyl amine d0,d3,d6
Summary • Spectra collected: • 1st-4th overtones of TMA d0-d9 • 1st-4th overtones of DMS • Most peaks were assigned • Predicted and experimental intensities match well • (HCAO)LM model showed bias towards trans CH • Possible evidence of coupling between the methyl groups
Metallocenes: Overtone Frequencies and C-H Bond length • Study 5 metallocenes • 3 overtones observed • rCH-CH correlation • Goal: To determine • The effect of metal on CH bond length • Mg(C2H5)2 ionic ? • If the combination bands are brightened by metal
Experimental • Spectra collected on an Nicolet Nexus 870 • Metallocenes in Carbon tetrachloride • Sodium cyclopentadienyl in THF • The first and second overtones • Metallocenes 1 cm path length • Sodium cyclopentadienyl 3mm path length • The third overtone • Metallocenes 10 cm path length • Sodium cyclopentadienyl 3mm path length • Bond length: Gaussian 98 at the BLYP/hybrid level.
Summary • Combination bands: • Not due to metal • Likely due to aromatic character of Na(Cp) • Mg(Cp)2 is likely not ionic • The nature of metal has little effect on rCH
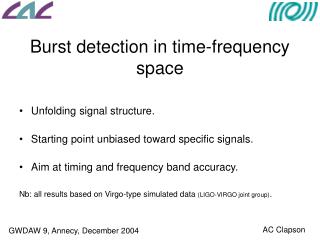
V-T relaxation of Overtones • The phase shift of a PA signal can determine V-T relaxation times • Little work on V-T relaxation of overtone vibrations. • V-T relaxation is of interest because: • Lazing of gases • Chemical kinetics • Transport properties
Dealing with variables • Previous studies have been hampered by many variables that effect V-T relaxation. These include: • Pressure • Incident radiation intensity • Presence of a buffer gas • Cell design • Electronics causing lag times • Heat relaxation of the gas • The use of a wire as a reference to eliminate problems with many of these variables
Possible Interpretations • Case 1: The wire takes longer to relax than V-T relaxation • Case 2: V-T relaxation causes a phase shift > 180º • Case 3: Resonance causes “Inversion of phase shift”
Test for Case 1 Signal of the heated wire with a 50 khz frequency In theory the relaxation of the wire cannot take longer than 0.00002 sec
Analysis for Case 1 • Negative apparent relaxations • |0,0>|6> < |6,0>|0> • |0,0>|7> < |0,0>|6> • All values < -0.00002 sec
Analysis for Case 2 • All relaxation times for TMA are negative • Positive relaxation time for Methane
Analysis for Case 3 • All relaxation times are positive • |0,0>|6> > |6,0>|0> • |0,0>|6> < |0,0>|7> • |6,0>|0> < |0,0>|7> • Methane 450 Times greater then what has been observed for the fundamental mode
Conclusions and Future Work • Case 3 seems to be the correct • More experimentation • Error unacceptably high • Replace resonance with a lock-in amplifier • Collect both signals simultaneously • Overall the system shows promise
Supervisor: Dr. K. M. Gough Committee Dr. A. Secco Dr. Tabisz Dr. Henry Dr. Wallace My Family & Friends My fellow Graduate students The Faculty and staff at the University of Manitoba Collaborators Dr. H. G. Kjaergaard Dr. G. Low Dr. Fedorov Dr. Snavely Dr. T. Gough Funding NSERC UMGF Brock award for Physical Chemistry Medicure Acknowledgements
(HCAO)LM Model Theory The oscillator strength between the ground state g and excited state e is given by: Where: Is the frequency of the transition in wavenumbers Is the dipole momment function |e> and |g> are the vibrational wavefunctions
LM Parameters • The values shown here a larger difference in anharmonicity • By using more values the previous work lower error was achieved • Agreement with previous work is generally within experimental error • In all cases the presence of Fermi resonance contributed to the error
(HCAO)LM Model Theory For a methyl group the Hamiltonian is that of three Morse oscillators Where: Is the energy at the ground vibrational state Is the vibrational quantum number Is the LM frequency Is the anharmonicity
(HCAO)LM Model Theory a and a+ are annihilation and creation operators, with approximately step down and step up properties The remaining terms are the coupling parameters
(HCAO)LM Model Theory The coupling parameters are Where Are elements of the G matrix Are elements of the force matrix
(HCAO)LM Model Theory Is the derivative of the dipole moment multiplied by (1/i!j!k!), obtained from 2D grids of the dipole moment as a function of both (q1,q2) and (q1,q3) q coordinates are displacements from equilibrium bond length
Fermi Resonance W is the perturbation function given by the anharmonic terms in the potential energy
Fermi Resonance =0 then 50/50 as increases approaches unperturbed