Download

1 / 20
210 likes | 509 Views
ECONOMIC GROWTH THROUGH SKILLS DEVELOPMENT – A SOCIO-ECONOMIC PERSPECTIVE. Premier’s Dialogue with SETAs & NSA Consultative Workshop 2 May 2013. POINT OF DEPARTURE. Economic growth is important to address socio-economic challenges Interrelationship between factors!

E N D
ECONOMIC GROWTH THROUGH SKILLS DEVELOPMENT – A SOCIO-ECONOMIC PERSPECTIVE Premier’s Dialogue with SETAs & NSA Consultative Workshop 2 May 2013
POINT OF DEPARTURE • Economic growth is important to address socio-economic challenges • Interrelationship between factors! • Education and skills are key elements in achieving economic growth • Scarcity of skills data on sub-national level! • Primary source of information – StatsSA • Census 2011, GDP & QLFS
ECONOMIC GROWTH IMPERATIVE “We need [economic] growth rates in excess of 5%...” President JG Zuma, 14 Feb 2013 (SONA) “We have to work hard and grow the provincial economy at a rate of between 5% and 7% per annum...” Premier DD Mabuza, 1 March 2013 (SOPA) “...the rate of economic growth needs to exceed 5% a year on average.” National Development Plan
IMPERATIVE – ACCELERATE ECONOMIC GROWTH • Growth target – average GDP growth minimum 5% per annum Forecasted growth
LINKING ECONOMIC GROWTH & EMPLOYMENT GROWTH High Medium Low
CHALLENGE – REDUCE UNEMPLOYMENT • 399 000 unemployed at the end of Q4 2012 • Youth (15-34 yr) = 72.7% of unemployed • Specific unemployment rates: • Male = 24.9% • Female = 34.8% • Youth (15-34 yr) = 40.3% • Additional 226 000 discouraged job seekers • Target to reduce unemployment to 15% by 2020 (MEGDP) and 6% by 2030 (NDP)
CHALLENGE – REDUCE POVERTY • In 2011, 1.59 million citizens of Mpumalanga lived in households with an income less than the poverty income (MLL) • e.g. R2 658 household of 4 & R3 695 household of 6 • Target to reduce % of people in poverty to 0% by 2030 (NDP)
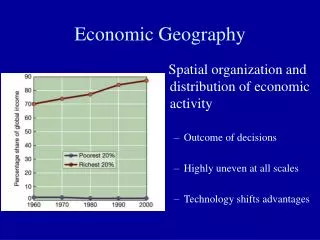
CHALLENGE – REDUCE INCOME INEQUALITY • National Gini-coefficient 0.63 in 2011 – increased from 0.62 in 1996 • Mpumalanga Gini-coefficient 0.62 in 2011 – increased from 0.60 in 1996 & therefore income distribution was more unequal in 2011 than it was in 1996 • In 2011, the wealthiest 20% of the population earned 68.2% of income & the poorest 40% only 8.1%
CHALLENGE – REDUCE INCOME INEQUALITY NDP target = poorest 40% to earn 10% of income by 2030
IMPROVE EDUCATION OUTCOMES TO IMPROVE EMPLOYABILITY • 20.1% of 2012 matriculants obtained admission to higher certificate studies • 29.8% of 2012 matriculants obtained admission to diploma studies • 19.8% of matriculants obtained admission to bachelor studies
CONCLUSION • To achieve higher economic growth: • The country has to develop the capabilities of the workforce on a broad scale so that we can grow faster • To reduce unemployment: • In order to raise employment, South Africa [Mpumalanga] needs better educational outcomes • To reduce poverty: • Eliminate poverty by....building capabilities • To reduce inequality: • Skills constraints push up the premium for skilled labour, inducing large difference in salaries of skilled & unskilled people, raising levels of inequality