Download
1 / 56
560 likes | 596 Views
Explore the intricate networks of oncogenes and tumor suppressor genes in cell cycle checkpoints, apoptosis, and cell survival. Investigate key nodes crucial to cancer-related processes and network stability. Discover pathways, topological analyses, and perturbation protocols in oncogenic and TSG networks for potential control and intervention strategies.

E N D
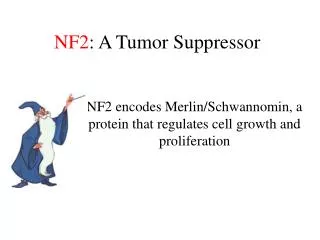
Baltazar D. Aguda Oncogene and Tumor Suppressor gene networks in cell cycle checkpoints, apoptosis & cell survival Mathematical Biosciences Institute Ohio State University bdaguda@mbi.osu.edu Seminar given at Indiana University-Purdue University at Indianapolis, 6 Oct 2006
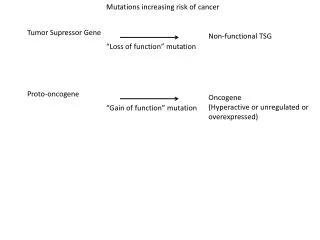
Oncogene Tumor Suppressor Gene cancer Normal Cell Abnormal Cell Transformed Cell DOMINANT (oncogene) x RECESSIVE (TSG) x x x x x x INTERMEDIATE Ref: R Hesketh, 1997
Oncogenes & TSGs associated with some human cancers breast carcinoma : MYB, MYC, cyclin D1, cyclin D3, EGFR, HER2, HRAS, HSTF1, INT2, YES1, P53, RB1, BRCA1 cervical carcinoma : P53, RB1, MYC, MYCN, HRAS colorectal carcinoma : APC, MCC, DCC, P53, TGFBR2, KRAS2 CML : BCR-ABL,MYC, NRAS,RB1, P53, ERG, TLS, HOXA9, NUP98, AML1, EAP, EVI1, MN1, TEL, MDS1
{ set of oncogenes & TSGs } Cellular processes involved? Molecular pathways & networks Network stability analysis & control The positions of these oncogenes and TSGs in these networks represent key nodes whose perturbations are crucial to the stability & evolution of the cancer-relevant cellular processes.
Cell cycle Apoptosis Signaling Angiogenesis Metastasis Senescence Etc. { set of oncogenes & TSGs } Cellular processes involved? Molecular pathways & networks Network stability analysis & control
Pathway ontology (BIOPAX) DBs/KBs (e.g. BIND, Biocarta, GenMAPP, Reactome) Proposal: Library of Pathway Modules (functional modules according to specific cellular processes; e.g. Biocarta) Repository of Models: Biomodels Database: http://www.ebi.ac.uk/biomodels/ CellML model repository: http://www.cellml.org/examples/repository/index.html { set of oncogenes & TSGs } Cellular processes involved? Molecular pathways & networks Network stability analysis & control
Topological analysis of qNETs (qualitative networks) Network modularization schemes [e.g. Aguda & Algar (2003) Cell Cycle 2: 538 ] Model extraction algorithms Network perturbation and control protocols { set of oncogenes & TSGs } Cellular processes involved? Molecular pathways & networks Network stability analysis & control
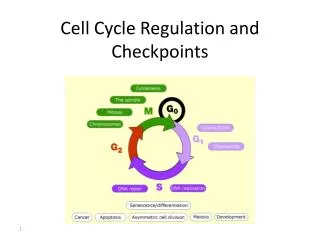
M G1 G2 R S The G1-S transition & Restriction Point
Ekholm SV, Zickert P, Reed SI, Zetterberg A. (2001) Mol Cell Biol 21: 3256. R G1 Fig 7 of reference above
Cyclin-D/cdk4 Cyclin-A/cdk2 TK, DHFR pRb pRB Cdc6 E2F ORC DP MCMs pre-RC Cdc7 Cdk2/Cyclin-E Cdk2/Cyclin-E p27 Cdc25A Myc Max G1-S regulatory network
RB1 defective in all retinoblastomas & in some other cancers: small cell-lung carcinomas non-small cell lung cancers bladder & pancreatic carcinomas human breast carcinoma human prostate carcinoma Cyclin-D/cdk4 Cyclin-A/cdk2 TK, DHFR pRb pRB Cdc6 E2F ORC DP MCMs pre-RC Cdc7 Cdk2/Cyclin-E Cdk2/Cyclin-E p27 Cdc25A Myc Max
E2F1 Lung carcinomas Etc. Cyclin-D/cdk4 Cyclin-A/cdk2 TK, DHFR pRb pRB Cdc6 E2F ORC DP MCMs pre-RC Cdc7 Cdk2/Cyclin-E Cdk2/Cyclin-E p27 Cdc25A Myc Max
Cyclin-D/cdk4 Cyclin-A/cdk2 KIP1 Leukemia, variety of solid tumors TK, DHFR pRb Cdc6 E2F ORC DP MCMs pre-RC Cdc7 Cdk2/Cyclin-E Cdk2/Cyclin-E p27 Cdc25A Myc Max
Cyclin-D/CDK4 Cyclin-A/cdk2 D-cyclin genes CCND1, CCND2, CCND3 D1 over-expressed in some gastric, breast, and aesophageal cancers. Sarcomas, uterine and colorectal carcinomas, malignant melanoma. TK, DHFR pRb Cdc6 E2F ORC DP MCMs pre-RC Cdc7 Cdk2/Cyclin-E Cdk2/Cyclin-E p27 Cdc25A Myc Max
Cyclin-D/CDK4 Cyclin-A/cdk2 CDK4 Dominant oncogene: CDK4 mutation is resistant to inhibition by INK4A. CDK4 and CDK6 over-expressed in some tumor cell lines and CDK4 is amplified in some tumors (50% glioblastomas). TK, DHFR pRb Cdc6 E2F ORC DP MCMs pre-RC Cdc7 Cdk2/Cyclin-E Cdk2/Cyclin-E p27 Cdc25A Myc Max
Cyclin-D/CDK4 Cyclin-A/cdk2 Myc Small cell lung carcinoma, breast and cervical carcinomas, Ewing’s sarcoma, Burkitt’s lymphoma, neuroblastoma, retinoblastoma TK, DHFR pRb Cdc6 E2F ORC DP MCMs pre-RC Cdc7 Cdk2/Cyclin-E Cdk2/Cyclin-E p27 Cdc25A Myc Max
Switching associated with R point? Cyclin-D/cdk4 Cyclin-A/cdk2 TK, DHFR pRb pRB Cdc6 E2F ORC DP MCMs pre-RC Cdc7 Cdk2/Cyclin-E Cdk2/Cyclin-E p27 Cdc25A Myc Max
Network Structure & Instability qNET analysis
• mij= [xi/ xj]o Cycle strength graph • Xi 1-cycle mii mij 0 Xjactivates Xi ( Xj Xi ) mij 0 Xj inhibits Xi ( Xj Xi ) • Xi Xj • 2-cycle mijmji • Xi Xj 3-cycle mijmjkmki • • Xk qNET graphs from M
eigenvalues are functions of cycles only dx/dt = f(x) d(Dx)/dt = M(Dx) det(λI-M) = ln + a1ln-1 + a2ln-2 + … + an-1l + an = 0 where a1 = i [-C1(i)] a2 = i,j [-C1(i)][-C1(j)] + jk [-C2(jk)] a3 = i,j,k [-C1(i)][-C1(j)][-C1(k)] + i,jk [-C1(i)][-C2(jk)] + ijk [-C3(ijk)] ... where C1(i) = mii (1-cycles) C2(jk) = mjkmkj (2-cycles) C3(ijk) = mijmjkmki (3-cycles) … ... Hurwitz Determinants, D = functions of Ck ‘s
X1 X2 1-cycle S = m33 2-cycleD = m12 m21 X3 3-cycleT = m21 m13 m32 sufficient instability conditions [1] S > 0 [2] T < 0 [3] SD < T when T > 0
X Y U MS MS U Y Y X X X Y X Y X Y X X X X X X X Y Y Y Y Y Y Y Y Y Y Y X Y U U U S U U U S X Y X Y X Y ? ? ? U U U S U U U X Y X X X X X Y X Y X Y X X Y X X X Y X Y X Y U S U U S U U U Y Y Y X Y X Y X Y U MS U Topologies qNET U = unstable S = stable Y X MS = marginally stable ? = undecided Y X Y X
Model Subnetwork for the Initiation of S phase Cyclin-D/cdk4 Cyclin-A/cdk2 TK, DHFR pRb pRB Cdc6 E2F ORC DP MCMs pre-RC Cdc7 Cdk2/Cyclin-E Cdk2/Cyclin-E p27 Cdc25A Myc Max
A SHARP SWITCH p27 CDK2 Cdc25A p27/CycE/CDK2 . . . iCycE/CDK2 p27 aCycE/CDK2 . . . . iCdc25A aCdc25A
CDK - Cdc25 couple Unstable couplings between cycles BD Aguda (1999) Oncogene 18: 2846.
[Y2]ss s 1r u s E2 Y1 X1 1f [Y2]ss 2f X2 Y2 E1 2r Y1 [ ]ss Y2 E1 Transcritical Bifurcation in Positively Coupled Cycles 0 0 ss Y1 & Y2 turned ‘on’ only if E1*E2 > (k1r/k1f)*(k2r/k2f) ss mass-action kinetics in graphs shown; similar for Michaelis-Menten kinetics 0
Simulation of CDK2 activation 1 sustained 2 t_off = 80 3 t_off = 50 4 t_off = 30 5 t_off = 29 6 t_off = 28 time GFs Cyclin D/CDK4 BD Aguda & Y Tang (1999) Cell Prolif. 32: 321.
Ekholm SV, Zickert P, Reed SI, Zetterberg A. (2001) Mol Cell Biol 21: 3256. R Fig 7 of reference above
Aguda (1999) PNAS Aguda (1999) Oncogene p27 Wee1 E/cdk2 B/cdk1 cdc25A cdc25C R G2 check G1 S G2 M target of checkpoint signaling: unstable network motifs Aguda & Tang (1999) Cell Proliferation
DNA damage signaling in G1 DNA damage ATM ATR ARF Chk1,2 Mdm2 Cdc25A degradation p53 Cdc25A Cyc E p21 CDK2 Pre-RC DNA replication J. Bartek & J. Lukas (2001) Curr. Opin. Cell Bio. 13 : 738
Oncogenes in G1 signaling Aguda BD (2001) Chaos 11 : 269-276.
CLASSIFICATION OF SIGNALING PATHWAYS signal signal signal signal die cycle die cycle die cycle die cycle I II III IV Modularization
details of Case I Myc Rb cycD/cdk4 E2F p53 Mdm2 ARF Bad Bax Bcl-2 Cdc25A cycE/cdk2 p27 DISC S phase Apoptosome Apoptosis Exec. Caspases
module-module interactions modeling Case I signal b b’ c a die cycle Aguda & Algar (2003) Cell Cycle 2: 538
apoptosis cycling quiescent ks signal intensity ksd2 Strength of negative feedback Craciun, Aguda & Friedman (2005) Mathematical Biosciences and Engineering 2: 473-485
p53 vs Akt Cell Survival and Death with K.B. (Dave) Wee, PhD student
p53 vs Akt Growth factors DNA damage p53 Akt FasL, Bax, PUMA Bad, Caspase9, FKHR APOPTOSIS MACHINERY DISC Apoptosome Exec. Caspases
Experimental indications of antagonism between p53 & Akt Bhuvanesh et al. Genes & Dev (2002) 16 p53 Akt
Feedback loops between p53 & Akt PTEN PIP3 Akt p53 Mdm2 Mayo, L. D. & Donner, D. B. (2002) Trends Biochem. Sci. 27, 462-467.
TP53 Mutated in about half of known human cancers. PTEN PIP3 Akt p53 Mdm2
PTEN PIP3 Akt PTEN Cancers of the breast, prostate, liver, stomach; gliomas; etc. p53 Mdm2
PTEN PIP3 Akt Akt1 Cancers of the breast, pancreas, prostate; carious carcinomas p53 Mdm2
Mdm2 Overexpressed in more than 40 different types of malignancies, incl. solid tumors, sarcomas, and leukemias PTEN PIP3 Akt p53 Mdm2
Akt* Model Q1 p53 AKT where
Steady State Level Active Akt Active p53 Total Akt Protein Level Bistable switch
p53 PTEN PIP3 Mdm2 AKT p53 AKT Mdm2 Robustness of bistable switch Wee & Aguda (2006) Biophys J