Download
1 / 1
10 likes | 135 Views
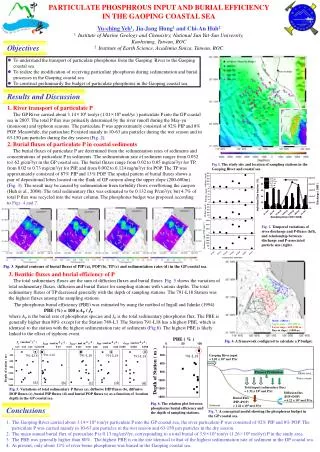
Primary Production. Fig.1. The study site and location of sampling stations in the Gaoping River and coastal sea. Fig. 2. Temporal variations of river discharge and P-fluxes (left), and relationship between discharge and P-associated particle size (right).

E N D
Primary Production Fig.1. The study site and location of sampling stations in the Gaoping River and coastal sea. Fig. 2. Temporal variations of river discharge and P-fluxes (left), and relationship between discharge and P-associated particle size (right). Fig. 3. Spatial contours of burial fluxes of PIP (a), POP (b), TP (c) and sedimentation rates (d) in the GP coastal sea. Fig. 4.A framework configured to calculate a P budget. Gaoping River input = 1.01 × 10⁹ mol P/yr Photic zone Water column Total input (sedimentary flux) = 1.32 × 10⁸ mol P/yr Diffusion flux (DIP+DOP) = 6.22 × 10⁶ mol P/yr Burial Flux (PIP+POP) = 1.26 × 10⁸ mol P/yr Fig. 5.Variations of total sedimentary P fluxes (a), diffusive DIP fluxes (b), diffusiveDOP fluxes (c), burialPIP fluxes (d) and burial POP fluxes (e) as a function of location depth in the GP coastal sea. Fig. 6. The relation plot between phosphorus burial efficiency and the depth of sampling stations. Sediment Fig. 7. A conceptual model showing the phosphorus budget in the GP coastal sea. PARTICULATE PHOSPHROUS INPUT AND BURIAL EFFICIENCY IN THE GAOPING COASTAL SEA Yu-ching Yeh1, Jia-Jang Hung1 and Chi-An Huh2 1. Institute of Marine Geology and Chemistry, National Sun Yat-San University, Kaohsiung, Taiwan, ROC 2.Institute of Earth Science, Academia Sinica, Taiwan, ROC Objectives • To understand the transport of particulate phosphorus from the Gaoping River to the Gaoping coastal sea. • To realize the modification of receiving particulate phosphorus during sedimentation and burial processes in the Gaoping coastal sea. • To construct preliminarily the budget of particulate phosphorus in the Gaoping coastal sea. Results and Discussion • River transport of particulate P • The GP River carried about 3.14×10⁴ ton/yr (1.01×10⁹ mol/yr ) particulate P into the GP coastal sea in 2007. The total P flux was primarily determined by the river runoff during the May-yu (monsoon) and typhoon seasons. The particulate P was approximately consisted of 92% PIP and 8% POP. Meanwhile, the particulate P existed mainly in 10-63 mm particles during the wet season and in 63-150 mm particles during the dry season (Fig. 2). 2. Burial fluxes of particulate P in coastal sediments The burial fluxes of particulate P are determined from the sedimentation rates of sediments and concentrations of particulate P in sediments. The sedimentation rate of sediment ranges from 0.032 to1.62 g/cm2/yr in the GP coastal sea. The burial fluxes range from 0.02 to 0.85 mg/cm2/yr for TP, from 0.02 to 0.73 mg/cm2/yr for PIP, and from 0.002 to 0.124 mg/m2/yr for POP. The TP was approximately consisted of 87% PIP and 13% POP. The spatial patternof burial fluxes shows a pair of depositional lobes located on the flank of GP canyon along the upper slope (200-600m) (Fig. 3). The result may be caused by sedimentation from turbidity flows overflowing the canyon (Huh et al., 2008). The total sedimentary flux was estimated to be 0.132 mg P/cm2/yr, but 4.7% of total P flux was recycled into the water column. The phosphorus budget was proposed according to Figs. 4 and 7. 3. Benthic fluxes and burial efficiency of P The total sedimentary fluxes are the sum of diffusion fluxes and burial fluxes. Fig. 5 shows the variation of total sedimentary fluxes, diffusion and burial fluxes for sampling stations with various depths. The total sedimentary fluxes of TP decreased generally with the depth of sampling stations. The 791-L18 Station was the highest fluxes among the sampling stations. The phosphorus burial efficiency (PBE) was estimated by using the method of Ingall and Jahnke (1994) PBE (%) = 100 × AP / JP where AP is the burial rate of phosphorus species and JP is the total sedimentary phosphorus flux. The PBE is generally higher than 80% except for the Station 789-L3. The Station 791-L18 has ahighest PBE, which is identical to the station with the highest sedimentation rate of sediments (Fig.6). The highest PBE is likely linked to the effect of typhoon event. Shelf ( <200 m ) Upper slope ( 200-600 m ) Lower slope ( 600-1000 m ) Base of slope ( >1000 m ) Conclusions • The Gaoping River carried about 3.14×10⁴ ton/yr particulate P into the GP coastal sea, the river particulate-P was consisted of 92% PIP and 8%POP. The particulate P was carried mainly in 10-63 µm particles in the wet season and 63-150 µm particles in the dry season. • The mean annual burial flux of particulate P is 0.13 mg/cm2/yr, corresponding to a total burial of 3.9×10³ ton/yr (1.26×10⁸ mol/yr) P in the study area. • The PBE was generally higher than 80%. The highest PBE is on the site identical to that of the highest sedimentation rate of sediment in the GP coastal sea • At present, only about 12% of river borne phosphorus was buried in the Gaoping coastal sea.