Metabolomics
Metabolomics. PCB 5530 Tom Niehaus Fall 2013. Learning Outcomes. • Learn the basics of metabolomics . • Understand the limitations of metabolomics. • Things to consider when using metabolomics for your own research. • See a typical outcome of a metabolomics experiment.

Metabolomics
E N D
Presentation Transcript
Metabolomics PCB 5530 Tom Niehaus Fall 2013
Learning Outcomes • Learn the basics of metabolomics • Understand the limitations of metabolomics • Things to consider when using metabolomics for your own research • See a typical outcome of a metabolomics experiment
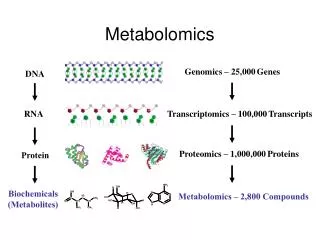
Definitions and Background Metabolome = the total metabolite pool • All low molecular weight (< 2000 Da) organic molecules in a sample such as a leaf, fruit, seedling, etc. Sugars Nucleosides Organic acids Ketones Aldehydes Amines Amino acids Small peptides Lipids Steroids Terpenes Alkaloids Drugs (xenobiotics)
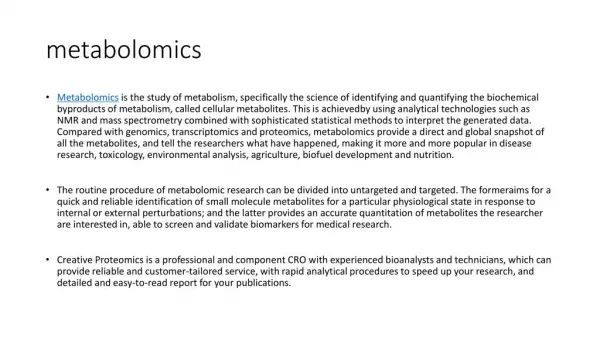
Definitions and Background Metabolomics = high-throughput analysis of metabolites Metabolomics is the simultaneous ('multiparallel') measurement of the levels of a large number of cellular metabolites (typically several hundred). Many of these are not identified (i.e. are just peaks in a profile). Not hypothesis driven snapshot
Definitions and Background History and Development • Metabolic profiling is not new. Profiling for clinical detection of human disease using blood and urine samples has been carried out for Centuries. This urine wheel was published in 1506 by UllrichPinder, in his book EpiphanieMedicorum. The wheel describes the possible colors, smells and tastes of urine, and uses them to diagnose disease. Nicholson, J. K. & Lindon, J. C. Nature 455, 1054–1056 (2008).
Definitions and Background History and Development • Advanced chromatographic separation techniques were developed in the late 1960’s. • Linus Pauling published “Quantitative Analysis of Urine Vapor and Breath by Gas-Liquid Partition Chromatography” in 1971 • Chuck Sweeley at MSU helped pioneer metabolic profiling using gas chromatography/ mass spectrometry (GC-MS) • Plant metabolic biochemists (e.g. LotharWillmitzer) were among other early leaders in the field. • Metabolomics is expanding to catch up with other multiparallel analytical techniques (transcriptomics, proteomics) but remains far less developed and less accessible.
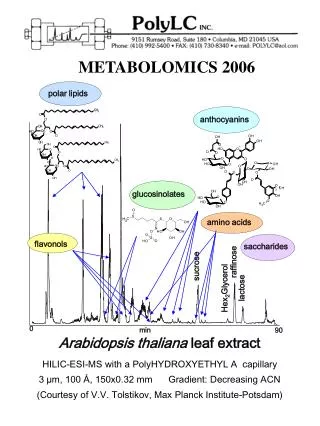
Definitions and Background Plant Metabolome Size • It is estimated that all plant species contain 90,000 - 200,000 compounds. • Each individual plant species contains about 5,000 – 30,000 compounds. e.g. ~ 5,000 in Arabidopsis The plant metabolome is much larger than that of yeast, where there are far fewer metabolites than genes or proteins (<600 metabolites vs. 6000 genes). The size of the plant metabolome reflects the vast array of plant secondary compounds. This makes metabolic profiling in plants much harder than in other organisms.
Definitions and Background The Power of Metabolomics Silent Knockout Mutations. ~90% of Arabidopsis knockout mutations are silent – i.e. have no visible phenotype and so provide no clues to gene function. (The search for some sort of visible phenotype therefore often becomes desperate.) The situation in yeast is similar – up to 85% of yeast genes are not needed for survival. When there is little or no change in growth rate (visible phenotype) of a knockout mutant, the pool sizes of metabolites have altered so as to compensate for the effect of the mutation, leaving metabolic fluxes are unchanged. Thus – intuitively – mutations that are silent when scored for metabolic fluxes or growth rate (growth rate is the sum of all metabolic fluxes) should have obvious effects on metabolite levels. There is a firm theoretical basis for this in MCA.
Definitions and Background The Power of Metabolomics Example. • In the Chloroplast 2010 project (phenotype analysis of knockouts of Arabidopsis genes encoding predicted chloroplast proteins): • Various knockouts showed essentially normal growth and color but highly abnormal free amino acid profiles, e.g. At1g50770 (‘Aminotransferase-like’)
Definitions and Background Limitations of metabolomics • High biological variance in metabolite levels (i.e., the variation between genetically identical plants grown in the same conditions) • Unlike nucleic acids and proteins, metabolites have a vast range of chemical structures and properties. Their molecular weights span two orders of magnitude (20–2000 Da). Therefore no single extraction or analysis method works for all metabolites. (Unlike DNA sequencing, microarrays, MS analysis of proteins – all are general methods.) • The concentrations of various metabolites can vary dramatically from mM to pM concentrations. • Some metabolites are labile and won’t survive extraction and analysis • Issues with chromatography, detection, and data analysis
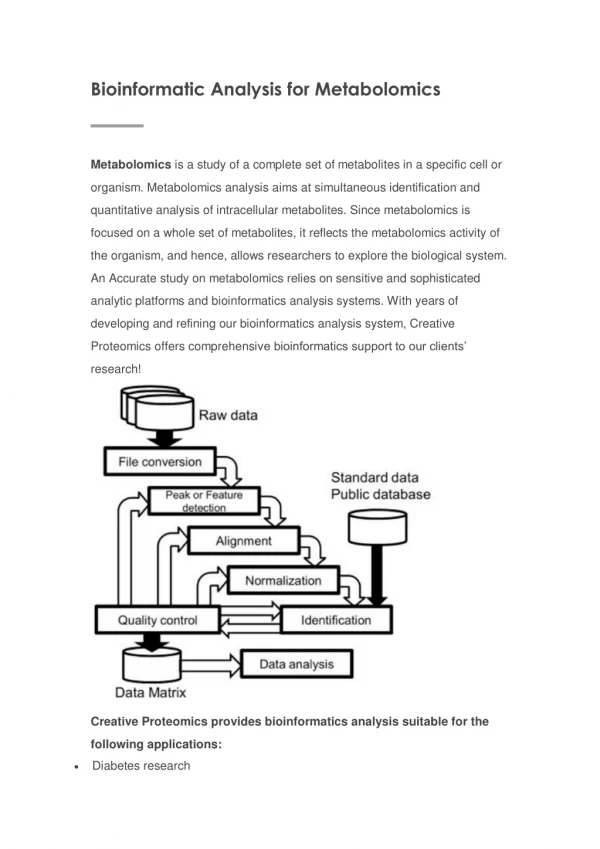
Metabolomics Steps in metabolomics sample preparation sample extraction chromatography detection data analysis
Sample Preparation Growth/Sample Size • Grow plants under identical conditions • Randomize the treatment groups (Make sure the effects you measure are due to the variable being testing) • number of replicates… depends on what you want to find • Large differences = small replication needed • Small differences = large replication needed • In general, six replicates for each treatment are needed (due to high biological variability)
Sample Preparation Sample collection • Uniform sample sizes (e.g. hole punches in leaves) • Be consistent - similar tissue - time of day • Quickly freeze sample in liquid nitrogen, store samples at -80°C
Sample Extraction Choosing an extraction method • No universal extraction method exists • Some solvents may degrade certain compounds • Its good to have some idea of what metabolites you want to extract
Sample Extraction Sample extraction • The method should be consistent and reproducible SPEX SamplePrep Grinder • Further workup may be required (e.g. solid phase extraction)
Chromatography introduction • Invented in 1900 by Mikhail Tsvet (used to separate plant pigments) • There are several types of chromatography, but all consist of a stationary phase and a mobile phase. Compounds are separated based on differential partitioning between the two phases. • Types include: - TLC (thin-layer chromatography) - GC (gas chromatography) - LC (liquid chromatography) Y GC and LC are routinely used in metabolomics
Chromatography Gas Chromatography • GC = ‘good chromatography’ • optimized over several decades • ~5 columns routinely used (5% diphenyl/95% methyl siloxane) • high reproducibility Identification based on RT Limitations: - high temperatures can destroy labile compounds - polar compounds cannot ‘fly’ on GC columns and must first be derivatized
Chromatography Sample derivatization Step 1) Methoximation Step 2) Silylation Z/E isomer have same mass spectrum but differ 2 seconds in retention time Gas chromatography requires volatile compounds (two step derivatization in vial) • 1) Methoximation of aldehyde and keto groups (primarily for opening reducing ring sugars) • 2) Silylation of polar hydroxy, thiol, carboxy and amino groups with silylation agent MSTFA • A single compound with multiple active groups will result in multiple peaks (1TMS, 2TMS, 3TMS) • GC-MS can distinguish between stereoisomers Anal Chem. 2009 Dec 15;81(24):10038-48. doi: 10.1021/ac9019522. FiehnLib: mass spectral and retention index libraries for metabolomics based on quadrupole and time-of-flight gas chromatography/mass spectrometry. Kind T, Wohlgemuth G, Lee do Y, Lu Y, Palazoglu M, Shahbaz S, Fiehn O.
Chromatography Liquid Chromatography • LC = ‘Lousy chromatography’ • fairly new, recent advances • thousands of columns available - normal phase -ion exchange - reverse phase • infinite solvent systems possible • low reproducibility Advantages: - compound can be collected after separation - derivatization not necessary - a separation protocol can be optimized for nearly any compound
Detection Mass Spectrometry • mass spectrometry is a technique to measure the mass of ions (m/z) • All mass spectrometers perform three main tasks: 1) Ionize molecules: 2) Use electric and magnetic fields to accelerate ions and manipulate their flight: 3) Detect ions (convert to electronic signal):
Detection Mass Spectrometry Example mass spectrum: relative abundance m/z
100 75 50 25 0 0 2.00 4.00 6.00 8.00 10.00 12.00 14.00 16.00 18.00 20.00 22.00 100 75 50 25 0 30 40 50 60 70 80 90 100 110 120 130 140 150 160 170 Detection Mass Spectrometry Normalized Intensity Peak selector Chromatogram (GC-MS) Time [min] Normalized Intensity 166 Mass spectrum (EI) 97 129 83 61 47 35 119 70 112 m/z
[M+H]+ Chemical Ionization (+) [M+28]+ [M+40]+ Electron Ionization (+) Mass Spectrometry Ionization: chemical vselecton Accurate mass [u] 397.1690 Mass accuracy [ppm] 5 Isotopic abundance error [%] 5 A+1 [%] 37.90 A+2 [%] 17.84 A+3 [%] 5.03 • [M+H]+ is very abundant in chemical ionization (CI) • Different ionization gases can be used such as NH3, methane, butane • Example picture: adduct ions at M+28.02=[M+C2H5]+ and M+40.04=[M+C3H5]+ are used for verification of [M+H]+
Adduct formation – expect the unexpected …around 290 different adducts Statistics: Adducts in NIST12 MS/MS DB (80,000 spectra) Most common adducts for LC-MS ([M+H]+ [M+Na]+ [M+NH4]+ [M+acetate]+)
Mass Spectrometry Mass Spectrometers • There are several types of mass spectrometers: - TOF (time of flight) - Q, QQQ (quadrupole) - Ion Trap - Orbitrap - FTICR (Fourier transform ion cyclotron resonance) Quad TOF
Mass Spectrometry Definitions and concepts • isomer- compounds with the same chemical formula e.g. propanol and isopropanol (C3H8O) C8H10N2O has 100,082,479 isomers • isobar- compounds with similar masses e.g. CO (27.9949) and C2H4 (28.0313) • isotopes- compounds with different numbers of neutrons in their nuclei e.g. 12C vs13C
Mass Spectrometry Definitions and concepts • Resolution (resolving power) RP(FWHM) = measured mass / peak width at 50% peak intensity • Accuracy Difference in true mass and measured mass • Mass range Range of ions that can be detected (typically 50-1000 m/z)
Mass Spectrometry Why is resolution important? • High resolution is needed to determine the accurate mass • High resolution is also needed to determine accurate isotopic patterns • Note: -monoisotopicvsave mass -accurate mass can distinguish isobars, not isomers
Mass Spectrometry Definitions and concepts • Dynamic range- the concentration range over which a linear response is obtained Determines the capability of an instrument to do quantitative analysis • Sensitivity- the lowest amount an instrument can detect • matrix effects- signal is muted due to complex sample or other unknown processes • Speed- the number of spectra or scans that can be acquired in one second 1 scan/ sec = very slow 500 scans/sec = very fast
Mass Spectrometry Why is high speed important? In order to deconvolute (separate/clean) overlapping peaks, enough mass spectra have to be acquiredto perform the mathematical calculations. With only one spectrum per second this is impossible. That requires: a) fast scanning detectors like time-of-flight (TOF) b) fast data acquisition hardware/software (DAC/ADC) The LECO TOF can acquire up to 500 mass spectra per second. For GC-MS 20 spectra/second sufficient for comprehensive GC (GCxGC) up to 200 spectra/sec needed Source: LECO ChromaTOF Helpfile
Mass Spectrometry Properties of various mass spectrometers
Data Analysis Goals • Identify all peaks In practice this is very difficult if not impossible • quantification or semi-quantification of compounds Often involves comparing samples or groups of samples e.g. wild-type vs knockout plant Various statistical tests to look for differences in the treatment groups e.g. PCA, MCA, ANOVA
Data Analysis Identifying peaks • Accurate mass can help determine the chemical formula: Example: sucrose (C12H22O11) Monoisotopic mass = 342.116211 Molecular weight calculator http://www.alchemistmatt.com/mwtwin.html
Data Analysis Identifying peaks • MS libraries can identify peaks (mostly GC/MS), especially when combined with RT information (GC/MS only): e.g. NIST library
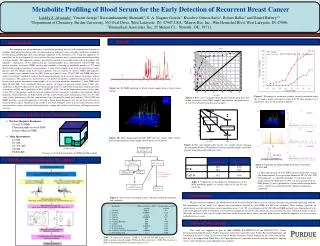
Data Analysis Example output of a metabolomics experiment
Data Analysis Pathway mapping