Download
1 / 27
270 likes | 421 Views
“This is a game-changer” John Hines Former Deputy Secretary for Water PA Department of Environmental Protection. July 1, 2013. Forward Looking Statements.

E N D
“This is a game-changer” John Hines Former Deputy Secretary for Water PA Department of Environmental Protection July 1, 2013
Forward Looking Statements This presentation contains, in addition to historical information, forward-looking statements regarding Bion Environmental Technologies, Inc. (the "Company"), which represent the Company's expectations or beliefs including, but not limited to, statements concerning the Company's operations, performance, financial condition, business strategies, and other information and that involve substantial risks and uncertainties. The Company's actual results of operations, most of which are beyond the Company's control, could differ materially. For this purpose, any statements contained in this presentation that are not statements of historical fact may be deemed to be forward-looking statements. Without limiting the generality of the foregoing, words such as "may," "will," "expect," "believe," "anticipate," "intend," "could," "estimate," “projected" or the negative or other variations thereof or comparable terminology are intended to identify forward-looking statements. Factors that could cause or contribute to such difference include, but are not limited to, limited operating history; uncertain nature of environmental regulation and operations; uncertain pace and form of development of nutrient (N&P) reduction market; risks of development of first of their kind Integrated Projects; need for substantial additional financing; competition; dependence on management; and other factors. Investors are urged to also consider closely the disclosures and risk factors in the Company’s current Form 10-K, filed with the Securities and Exchange Commission, available at www.sec.gov.
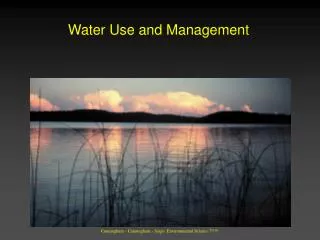
Two Multi-Billion $ Investment Spaces Agriculture Livestock Water Agriculture consumes 70% of the water used in the US
Bion Overview • Excess nutrients recentlyacknowledged by US EPA as the greatest water quality problem in the U.S. today – livestock/agriculture • Bion’s technology largely eliminates the environmental impacts of large-scale livestock production, focused on nutrients • ONLY technology that provides comprehensive treatment for ‘wet waste’ stream (dairy, beef cattle and swine) • Reclaims renewable energy and nutrients from the waste stream • Proven, scalable, commercially-tested, 7 US patents + international ____________________________________________________________________ • New Integrated Projects • Increased scale – reduced acreage; strategic locations – reduced transportation costs; resource and operational efficiencies • Existing operations • On-site treatment with scale/central processing facilities • Substantially lower-cost alternative to publicly-funded downstream wastewater treatment
US Clean Water Spending • Largest cost driver: nitrogen removal • Current strategy: Sector Allocation to regulated point sources and storm water – regardless of costs or efficiencies • NO LONGER SUSTAINABLE
Sector Allocation Ignores Largest Source • Point-Source: 20 to 30% of load • Regulated since 1972 • Currently removing high levels of N • Increased removal rates = last mile cost • Non Point-Source: 70 to 80% of load • Livestock is largest contributor • Largely unregulated • Significantly lower removal costs • Result: we discharge very clean (and very expensive) water into already polluted water – Chesapeake Bay, GOM, Great Lakes
Livestock: Largest Source of Excess Nutrients Traditional Manure Management Practice Nitrogen released as ammonia gas (NH4) [50%] Manure slurry Lagoon 75% N lost to the environment Manure slurry Field N Run-off [25%] Crop Uptake [25%] Aquifers Surface Waters Downstream Estuaries • Chesapeake Bay, GOM, Great Lakes, etc, etc, etc. • Hypoxia from algae/phytoplankton blooms from excess nitrogen • Pathogens, toxic blooms • Very expensive to treat water downstream now that nitrogen is diluted with millions of gallons of water
How Big is the Problem? • 12 million dairy cows (including support herd) • 66 million swine • 100 million cattle/calves • 2 billion chickens and turkeys • Nutrient load 30 to 100X human waste US EPA: Excess nutrients are the greatest water quality problem in the US today • Increased scrutiny of ammonia and greenhouse gas emissions, pathogens, antibiotics and hormones
Liability to Asset: Separate and Aggregate Traditional Manure Management Practice Manure slurry Nitrogen released as ammonia gas (NH4) [50%] Lagoon Manure slurry 75% N lost to the environment Field N Run-off [25%] Crop Uptake [25%] Aquifers Surface Waters Downstream Estuaries • Chesapeake Bay, GOM, Great Lakes, etc, etc, etc. • Hypoxia from algae/phytoplankton blooms from excess nitrogen • Pathogens, toxic blooms • Very expensive to treat water downstream now that nitrogen is diluted with millions of gallons of water
Chesapeake Bay TMDL • Executive Order 13508 (May 12, 2009) • US EPA TMDL: Total Maximum Daily Load • Reduce~75M lbs of nitrogen per year by 2025 • Estimated cost (Bay-wide): • 2009: $15B to $28B • 2012: $30B to $50B
PA’s TMDL Compliance • 31 million pounds of nitrogen annually by 2025 • Tier 1 municipal treatment plant upgrades: completed • 3 million pounds of nitrogen • $1 billion CAPEX; $15 million annual O&M • $35 per pound annual cost • Tier 2 municipal treatment plant upgrades: potential • 2 million pounds of nitrogen • Higher cost per pound • All credits must be verified by 2015 • BMP modeled credits will be reduced through verification • No more manure hauling, unused municipal plant capacity credits after 2015 At least 26 million pounds short
PA Legislative Study Report (Jan 2013) • PA Legislative Budget and Finance Committee • Access lower-cost upstream solutions (primarily livestock) through a competitively-bid RFP program • Recommended 15- to 20-year contracts (with PA) • Cost savings up to 80% of previous estimates = more than $1.5 billion in annual tax payer savings • Greater value in upstream benefits to interior PA waters and communities AT NO ADDITIONAL COST • Bids should be scored to reflect upstream values • “Absent the implementation of cost-cutting measures, Pennsylvania’s compliance with the CB TMDL standard is at risk as there is insufficient funding available to comply under today’s existing cost structure.”
Annual Cost of Upstream Alternatives • Bion can begin delivery of up to 2 million pounds based on full operation of Kreider 1 and 2 systems (target 2014)
Coalition for an Affordable Bay Solution • www.affordablebaysolutions.org • Support the creation of a competitively-bid nitrogen procurement program in Pennsylvania • Capture benefits outlined in PA Legislative Study • Open to all sources: public and private; regulated and unregulated • Chesapeake Bay Total Maximum Daily Load (TMDL) compliance cost can be reduced by as much as 80% • Upstream treatment strategy benefits • Reduced cost for freshwater compliance • Cost-avoidance of future treatment of nitrate-contaminated aquifers • Improved public health and safety • Local economic activity – recreation, agriculture, property values • Bids will be ‘scored’ to reflect value of upstream benefits • Coalition head: Ed Schafer, former Secretary of the USDA and two-term Governor of North Dakota, currently Bion Vice Chairman
Coalition Founding Members www.biontech.com www.kreiderfarms.com www.fofarms.com www.jbssa.com
PA Senate Bill 994 • Introduced June 5, 2013 by Sen Elder Vogel, Chairman of Senate Agriculture and Rural Affairs Committee • Establish a competitive bidding program for low-cost watershed nutrient reductions • Co-sponsored by Senators Scarnati, Alloway, Vance, Mensch, Yudichak, Smucker, Argall, Folmer, Browne And Greenleaf • Enjoys broad-based support • Passed Senate Agriculture and Rural Affairs Committee on June 11 and moved to the Appropriations Committee • Was not considered by the end of the June session (which was dominated by several controversial budget issues in the last couple weeks) • Bion expects adoption of the Bill in the September session
Kreider Farms Economics • Kreider 1: 2,000 dairy cows (operating) • Kreider 1 financed by PENNVEST (PA Infrastructure Investment Authority) - $7.8 million, non-recourse, low interest, 10 yr • Anticipate Kreider 1 revenues Q3/Q4 2013 • Kreider 2: 7 million chickens (target 2014) • Kreider 1 & 2: 1.5 to 2.5+ million pounds annually at $8+ per pound per year when in full operation • Anticipate $7M to $10M annual EBITDA when Kreider 1 & 2 in full operation at 2M pounds • Future Kreider expansion (Phase 3) should increase to 3 million pounds (target 2015)
Utility Revenue Model (Kreider Only) • Customer: Pennsylvania • 15 to 20 year guaranteed off-take agreements (per PA study recommendations) • Comparables P/E • York Water (YORW) 25.5 • Aqua America (WTR) 22.7 • American Water Works (AWK) 20.5 • Implied valuation of Kreider Project (20 P/E) • Phase 1 & 2 (2M pounds) $140M to $200M • Phase 1,2,3 (3M pounds)$260M to $320M • Kreider CAPEX (Bion) $15M • PA opportunity 10M+ pounds
U.S. Watershed Model • US EPA: Chesapeake Bay will be a model for watershed nutrient management in US • Great Lakes: ~300 million pounds of nitrogen • Mississippi River Basin: ~1 billion pounds • Bion is a model for Public-Private Partnership strategy supported by US EPA • Bion’s Kreider Farms nitrogen reductions verified under US EPA-approved nutrient trading program • Bion was a panelist on US EPA’s inaugural national water quality trading workshop – only representative of private sector solutions
Market Analysis – Potential U.S. Retrofit • Thousands of scale-suitable farms* • Dairy • 44% of US dairy cows on farms over 1,000 head • 5,280,000 head (including support herd) • Swine • 61% of US swine on farms over 5,000 head • 40,260,000 head • International opportunities • No competitors to date • Increased future regulation of Concentrated Animal Feeding Operations (CAFOs)? Ammonia? Greenhouse gases? Pathogens? Antibiotics? Hormones? *Not all farms in nutrient-impaired watersheds
Economic Benefits to Agriculture • New revenue sources – environmental incentives • Asset recovery: by-products • Renewable energy • High-quality stable fertilizer • Single-cell protein product – animal feed • Aqueous soluble nutrient stream • Clean water for reuse • “Sustainable” branding • Reduced acreage requirements • Relocation or expansion absent land acquisition • Environment wins; taxpayers win; farmers win
Bion Technology: Highest and Best Use • New state-of-the-art, large scale, highly-efficient livestock production facilities in strategic locations, with a minimal environmental and physical footprint, that can be integrated with dedicated food processing (and in some locations biofuels production)
Current Beef Supply Chain Problems Finishing Cow calf operations Market Market Refrigerated transport Cow calf operations Refrigerated transport Further Process Slaughter Further Process Backgrounding on grass Refrigerated transport Market Refrigerated transport Market Cow calf operations Slaughter Cow calf operations Finishing
Bion Integrated ProjectCompetitive Advantages from Advanced Waste Treatment • Small physical footprint – reduced CAPEX • Increased scale/density • Co-locate processing • Co-locate biofuels • Non-traditional strategic locations Waste Livestock Biofuels Distiller Grains Inputs • Single-sourcing • Branding • Food safety/security • Energy/resource efficiencies • Onsite production and use of renewable energy • By-products • Substantially reduced transportation costs Energy Meat/Milk Processor Waste Livestock Energy Waste Energy Bion System Bion System Bion System Livestock <50 miles Nutrients Water
Bion Beef Supply Chain Model Market Cow calf operations Market Cow calf operations Integrated Backgrounding Finishing Slaughter & Further Process Feeder stock transport Integrated Backgrounding Finishing Slaughter & Further Process Feeder stock transport Cow calf operations Market Cow calf operations Market • Low cost producer • Reduced risks – improved margins
Bion’s Integrated Projects • Industry generally unable to obtain permits since 2000 • Kreider full Water Quality Management Permit issued by PA DEP August 2012…first ever in US • Increase annual EBITDA returns by five percentage points (or more) over existing industry metrics • IP’s with scale and attributes described are only possible today utilizing Bion’s patented and proprietary technology • Preliminary and on-going discussions with several regionally-, nationally- and internationally-known food producers, processors, and distributors
Investment Criteria • True paradigm shifts • Nitrogen reductions 50% to 90% cheaper than traditional treatment strategy – current funding over $100B annually • Integrated Projects: logical next step in livestock production efficiencies • Technology validated – third generation, scalable, proven, accepted • Strong IP portfolio • Very large, addressable market with substantial barriers to entry • Recognized industry thought leader • Strong management team – Exec Vice Chrmn: Ed Schafer, former US Sec. of Agriculture and two-term Gov of North Dakota • At the technology and business inflection point – heavy lifting done (tech accepted, policies evolving); anticipate revenues in 2013 • Valuation: $34M @ $2.00 ($55M FD) – Kreider projects alone anticipated to produce $7M to $10M operating cash flow (EBITDA) • Primary risk: timing • Trades OTC BB/QB: BNET (seek up-list this summer)