Download
1 / 1
10 likes | 159 Views
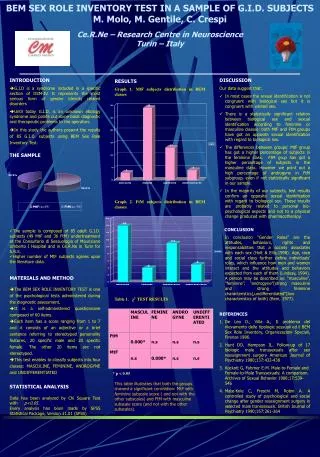
BEM SEX ROLE INVENTORY TEST IN A SAMPLE OF G.I.D. SUBJECTS M. Molo, M. Gentile, C. Crespi Ce.R.Ne – Research Centre in Neuroscience Turin – Italy. onlus. onlus. INTRODUCTION

E N D
BEM SEX ROLE INVENTORY TEST IN A SAMPLE OF G.I.D. SUBJECTS M. Molo, M. Gentile, C. Crespi Ce.R.Ne – Research Centre in Neuroscience Turin – Italy onlus onlus • INTRODUCTION • G.I.D is a syndrome included in a specific section of DSM-IV. It represents the most serious form of gender identity related disorders • Until today G.I.D. is an unknown etiology syndrome and points out some basic diagnostic and therapeutic problems to the operators. • In this study the authors present the results of 85 G.I.D. subjects using BEM Sex Role Inventory Test. THE SAMPLE • The sample is composed of 85 adult G.I.D. subjects (49 MtF and 36 FtM) undertreatment at the Consultorio di Sessuologia of Mauriziano Umberto I Hospital and in Ce.R.Ne in Turin for S.R.S. • Higher number of MtF subjects agrees upon the literature data. MATERIALS AND METHOD • The BEM SEX ROLE INVENTORY TEST is one of the psychological tests administered during the diagnostic assessment. • It is a self-administered questionnaire composed of 60 items. • Each item has a score ranging from 1 to 7 and it consists of an adjective or a brief sentence referring to stereotyped personality features, 20 specific male and 20 specific female. The other 20 items are not stereotyped. • This test enables to classify subjects into four classes: MASCULINE, FEMININE, ANDROGYNE and UNDIFFERENTIATED STATISTICAL ANALYSIS Data has been analyzed by Chi Square Test with p<0.05. • Every analysis has been made by SPSS Statistical Package, Version 11.01 (SPSS) • DISCUSSION • Our data suggest that: • In most cases the sexual identification is not congruent with biological sex but it is congruent with wished sex. • There is a statistically significant relation between biological sex and sexual identification according to feminine or masculine classes: both MtF and FtM groups have got an opposite sexual identification with regard to biological sex. • The differences between groups: MtF group has got a higher percentage of subjects in the feminine class. FtM grup has got a higher percentage of subjects in the masculine class. However we point out a high percentage of androgyne in FtM subgroup, even if not statistically significant in our sample. • In the majority of our subjects, test results confirm an opposite sexual identification with regard to biological sex. These results are probably related to personal bio-psychological aspects and not to a physical change produced with pharmacotherapy. CONCLUSION In conclusion “Gender Roles” are the attitudes, behaviors, rights and responsabilities that a society associates with each sex (Holt & Ellis,1998). Age, race and social class further define individuals’ roles, which influence how men and women interact and the attitudes and behaviors expected from each of them (Lindsay, 1994). A person may be described as: “masculine”, “feminine”, “androgyne”(strong masculine and strong feminine characteristics),undifferentiated”(low characteristics of both) (Bem, 1977). REFERENCES • De Leo D., Villa A., Il problema del rilevamento delle tipologie sessuali ed il BEM Sex Role Inventory, Organizzazioni Speciali, Firenze 1986. • Hunt DD, Hampson JL. Follow-up of 17 biologic male transsexuals after sex reassignment surgery American Journal of Psychiatry 1980;137:432-438 • Kockott G, Fahrner E-M. Male-to-Female and Female-to-Male Transsexuals: A comparison. Archives of Sexual Behavior 1988;17:539-546 • Mate-Kole C, Freschi M, Robin A. A controlled study of psychological and social change after gender reassignment surgery in selected male transsexuals. British Journal of Psychiatry 1990;157:261-264 RESULTS Graph 1. MtF subjects distribution in BEM classes Graph 2. FtM subjects distribution in BEM classes Table 1. χ2 TEST RESULTS This table illustrates that both the groups showed a significant correlation: MtF with feminine subscale score ( and not with the other subscales) and FtM with masculine subscale score (and not with the other subscales). (n=49) (n= 36) * p < 0.05