Regression Diagnostics
Regression Diagnostics. Fall 2013 Dec 12/13. Why Regression Diagnostics?.

Regression Diagnostics
E N D
Presentation Transcript
Regression Diagnostics Fall 2013 Dec 12/13
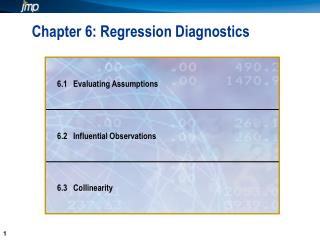
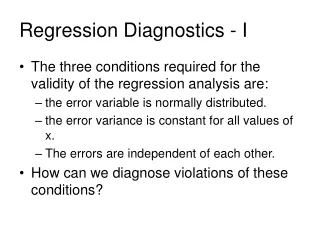
Why Regression Diagnostics? • The validity of a regression model is based on a set of assumptions. Violation of basic assumptions cast doubt on regression results.Regression Diagnostics are a set of “tests” used to check those assumptions. • Assumptions: • 1. Data Accuracy; Linearity; Absence of Multicollinearity • 2. Normality of Errors; Errors Cancel on Average; Homoscedasticity of Errors; Influential Outliers
Before Regression • Data Accuracy and Linearity: • Identify possible outliers and check for accuracy • Creating scatter plots of each independent and the dependent variable • Absence of Multicollinearity: • Multicollinearity exists when a linear relationship exists between two or more independent variables. • Check pair-wise correlation coefficients between independent variables. |r|≥0.8 indicates a multicollinearity problem.
After Regression Calculate residuals • Normality of Errors Plot residuals in a histogram and an ogive. The histogram should be bell-shaped and the ogive S-curved if errors are normally distributed. • Errors Cancel on Average Check the mode of residuals in the histogram and the mean in Descriptive Statistics. They should be close to zero.
After Regression • Homoscedasticity of Errors: Error has a constant variance over the full range of the dependent variable. Plot the residuals against the predicted Y. • Outliers • One influential observation may change the sign of a slope coefficient or the magnitude substantially. • Check standardized residuals: how many standard deviations one residual is away from the mean. • A standardized residual greater than 3 in absolute value indicates an outlier.