Understanding Research Design: Key Concepts in Statistical Inference and Data Classification
This guide serves as a comprehensive study resource for students tackling statistical inference in management. It covers essential topics such as experimental design (single vs. double blind), types of variables (independent, dependent, categorical, numerical), and the importance of operational definitions. The material includes crucial readings before upcoming exams and emphasizes effective questionnaire design and evaluation methods. Be sure to bring all required materials to class and adhere to deadlines for assignments to gain extra credit.


Understanding Research Design: Key Concepts in Statistical Inference and Data Classification
E N D
Presentation Transcript
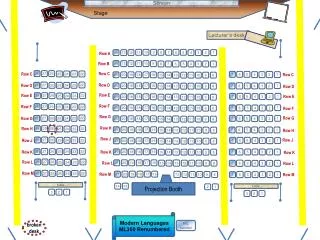
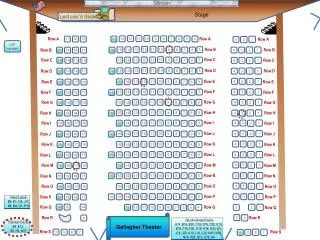
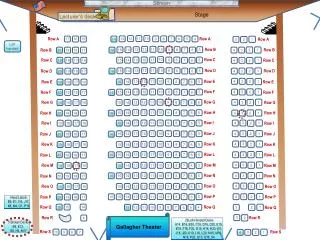
Stage Screen Lecturer’s desk 11 10 9 8 7 6 5 2 14 13 12 4 3 1 Row A 14 13 12 11 10 9 6 8 7 5 4 3 2 1 Row B 28 27 26 23 25 24 22 Row C 7 6 5 Row C 2 4 3 1 21 20 19 18 17 16 13 Row C 15 14 12 11 10 9 8 22 27 28 26 25 24 23 Row D 1 Row D 6 21 20 19 18 17 16 13 7 5 4 3 2 15 14 12 11 10 9 8 Row D Row E 28 27 26 22 Row E 23 25 24 7 6 5 1 2 4 3 Row E 21 20 19 18 17 16 13 15 14 12 11 10 9 8 Row F 28 27 26 23 25 24 22 Row F 1 6 21 20 19 18 17 16 13 7 5 4 3 2 15 14 12 11 10 9 8 Row F Row G 22 27 28 26 25 24 23 7 6 5 1 Row G 2 4 3 Row G 21 20 19 18 17 16 13 15 14 12 11 10 9 8 Row H 28 27 26 22 23 25 24 Row H 6 21 20 19 18 17 16 13 7 5 4 3 2 1 15 14 12 11 10 9 8 Row H Row J 28 27 26 23 25 24 22 7 6 5 Row J 2 4 3 1 Row J 21 20 19 18 17 16 13 15 14 12 11 10 9 8 22 27 28 26 25 24 23 6 21 20 19 18 17 16 13 7 5 4 3 2 1 15 14 12 11 10 9 8 Row K Row K Row K 28 27 26 22 23 Row L 25 24 21 20 19 18 17 16 13 6 15 14 12 11 10 9 8 Row L 7 5 4 3 2 1 Row L 28 27 26 22 23 Row M 25 24 21 20 19 18 17 16 13 6 12 11 10 9 8 Row M 7 5 4 3 2 1 Row M table • Projection Booth 14 13 2 1 table 3 2 1 3 2 1 Modern Languages ML350 Renumbered R/L handed broken desk
Use this as your study guide By the end of lecture today1/24/12 Single versus Double Blind Studies Nominal, Ordinal, Interval, Ratio Categorical vs Numerical (Quantitative vs Qualitative) Field observation/naturalistic research Time series design vs. Cross sectional design Surveys and questionnaire design Snowball sampling, convenience sampling Questionnaire design and evaluation
Schedule of readings Before next exam: Please read chapters 1 - 4 & Appendix D & E in Lind Please read Chapters 1, 5, 6 and 13 in Plous Chapter 1: Selective Perception Chapter 5: Plasticity Chapter 6: Effects of Question Wording and Framing Chapter 13: Anchoring and Adjustment
MGMT 276: Statistical Inference in ManagementRoom 350 Modern LanguagesSpring, 2012 Welcome Remember to hold onto homework until we have a chance to cover it http://www.youtube.com/watch?v=Ahg6qcgoay4&watch_response
Remember bring your writing assignment forms notebook and clickers to each lecture Complete this by January 31st, 2012 and receive extra credit!
Two Homework assignments due at same time – Tuesday (January 31st) On class website: please print the worksheetthat describes homework assignments 2 & 3 Please double check – Allcell phones other electronic devices are turned off and stowed away
First test group with placebo drink (sugar pill) If you want to know if “Ginseng drink” is associated with feelings of satisfaction What is the independent variable? What is the dependent variable? How many levels are there of the IV? “Between” or “within” participant design? Placebo Then test same group with “Ginseng drink”
Placebo (single blind) versus double blind procedure • Single blind procedure (example: use of placebo) • Double blind procedure What about experimenter bias?
So far, Measurement: observable actions Theoretical constructs: concepts (like “humor” or “satisfaction”) Operational definitions Validity and reliability Independent and dependent variable Random assignment and Random sampling Within-participant and between-participant design Single blind (placebo) and double blind procedures
Duration Continuous versus discrete Continuous variable: Variables that can assume any value. There are (in principle) an infinite number of values between any two numbers Discrete variable: Variables that can only assume whole numbers. There are no intermediate values between the whole numbers Distance Number of kids Height Number of eggs in a carton Number of textbooks required for class
Categorical versus Numerical data Categorical data (also called qualitative data) - a set of observations where any single observation is a word or a number that represents a class or category Numerical data (also called quantitative data) - a set of observations where any single observation is a number that represents an amount or count
Categorical data (also called qualitative data) - a set of observations where any single observation is a word or a number that represents a class or category Numerical data (also called quantitative data) - a set of observations where any single observation is a number that represents an amount or count Handedness - right handed or left handed Family size Hair color Ethnic group GPA Age Yearly salary Breed of dog Gender - male or female Temperature Please note this is a binary variable
Categorical data (also called qualitative data) - a set of observations where any single observation is a word or a number that represents a class or category Numerical data (also called quantitative data) - a set of observations where any single observation is a number that represents an amount or count On a the top half of a writing assignment form please generate two examples of categorical data and two examples of numerical data Please note we’ll use the bottom half for something else
What are the four “levels of measurement”? Categorical data • Nominal data - classification, differences in kind, names of categories • Ordinal data - order, rankings, differences in degree Numerical data • Interval data - measurable differences in amount, equal intervals • Ratio data - measurable differences in amount with a “true zero”
What are the four “levels of measurement”? Categorical data • Nominal data - classification, differences in kind, names of categories • Ordinal data - order, rankings, differences in degree Numerical data • Interval data - measurable differences in amount, equal intervals • Ratio data - measurable differences in amount with a “true zero” Gender - male or female Family size Jersey number Place in a foot race (1st, 2nd, 3rd, etc) Handedness - right handed or left handed
What are the four “levels of measurement”? Categorical data • Nominal data - classification, differences in kind, names of categories • Ordinal data - order, rankings, differences in degree Numerical data • Interval data - measurable differences in amount, equal intervals • Ratio data - measurable differences in amount with a “true zero” Age Hair color Telephone number Ethnic group Breed of dog Temperature Yearly salary
Please note : page 29 in text
What are the four “levels of measurement”? Categorical data • Nominal data - classification, differences in kind, names of categories • Ordinal data - order, rankings, differences in degree Numerical data • Interval data - measurable differences in amount, equal intervals • Ratio data - measurable differences in amount with a “true zero” Look at your examples of qualitative and quantitative data. Which levels of measurement are they?
Questionnaires use self-report items for measuring constructs. Constructs are operationally defined by content of items. Wording “Would you say our president is a great president or the greatest president?” The Colbert Report How might we word a question about the Iraq war if we wanted it to reflect support / not? How might we word a question about the gay marriage if we wanted it to reflect support / not? Order How satisfied are you with your relationships with your family? How satisfied are you with your relationship with your romantic partner? spouse?
5 Principles of questionnaire construction 1. Make sure items match research objectives & Identify what constructs you are trying to understand (Be explicit in identifying your constructs) • 2. Responders have the answers to our questions • We are tapping into their attitudes/beliefs/ knowledge • Understand your research participants • “think like” the responders / consider their sensibilities • use appropriate, natural and familiar language (for them) • Be clear, precise and concise (short questions) • don’t make them work any harder than they need to 3. Use appropriate, natural and familiar language
5 Principles of questionnaire construction • 3. Assessment should feel easy and clear, unthreatening • Be clear, precise and concise (short questions) • Minimize use of contingency questions • Start with most friendly (least threatening) questions first • then at the end “now a couple questions about you” (foot in the door phenomenon) • Avoid double negatives • For example: • Agree or disagree? • Teachers shouldn’t have less contact with parents • 4. Avoid ambiguity and bias in your items • Avoid “double-barreled” questions - Difficult to interpret answers • Avoid leading or loaded questions - Can introduce bias • Consider problem of acquiescence – Ask question in different ways • (careful with coding)
5 Principles of questionnaire construction 5. Consider lots of different formats for responses • Consider open-ended vsclosed-ended questions - pros and cons of each - can often modify a question into a closed question • Consider complementing your questionnaire with other forms of data collection (focus group or direct observation) • Pilot – feedback – fix - pilot – analyze – fix - pilot – etc Respect process of empirical approach
Thank you! See you next time!!