Download
1 / 13
130 likes | 304 Views
CO 2 Sources - Update. February 8, 2007. Contents. Power Plants (Updated) Ammonia (Updated) Cement (Updated) Gas Processing (Working) Refineries (Updated) Ethanol (Updated). Power Plants. eGRID Plant level information on all U.S. power plants Compiled by EPA

E N D
CO2 Sources - Update February 8, 2007
Contents • Power Plants (Updated) • Ammonia (Updated) • Cement (Updated) • Gas Processing (Working) • Refineries (Updated) • Ethanol (Updated)
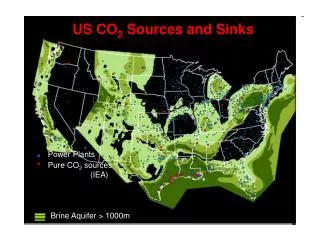
Power Plants • eGRID • Plant level information on all U.S. power plants • Compiled by EPA • Current version released in 2006, with emissions information for 2004 • eGRID database contains • Plant name • Plant location (County, geographic coordinates) • Boiler and generator information (quantity and capacity) • Emissions (NOx, SO2, CO2), annual and per MWh • Ownership information (Top 14 owners and percent share)
Ammonia • Comparison • 2006: 34 plants 13258 kt ammonia /yr 15 Mt CO2 /yr • 2004: 44 plants 14754 kt ammonia /yr 16.7 Mt CO2 /yr
Cement Old
Cement • Data Source • Old: Portland Cement Association, 2002 • New: NatCARB, 2006 (extracted from the EPA Aerometric Information Retrieval System) • Comparison * only 29 plants have location information.
Gas Processing (working) (2003 data)
Refineries • Comparison *1000 barrels / stream day
Ethanol Source: Greg
Ethanol • Data Source • Old: 2003 SRI international CO2 Chemical Economics Handbook (Not included in our database) • New: NatCARB, 2006 *Short Tons per day