Download
1 / 8
80 likes | 257 Views
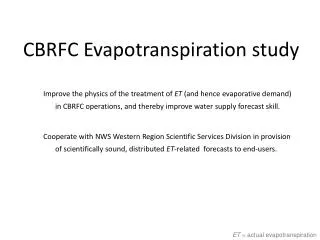
CBRFC Evapotranspiration study. Improve the physics of the treatment of ET (and hence evaporative demand) in CBRFC operations, and thereby improve water supply forecast skill.

E N D
CBRFCEvapotranspiration study Improve the physics of the treatment of ET (and hence evaporative demand) in CBRFC operations, and thereby improve water supply forecast skill. Cooperate with NWS Western Region Scientific Services Division in provision of scientifically sound, distributed ET-related forecasts to end-users. ET = actual evapotranspiration
How ET is currently estimated by the NWS River Forecast System • Sacramento-Soil Moisture Accounting (Sac-SMA) model evaporates soil moisture from two depths. • Ep driven by Epan climatology: • e.g., Jan 1, 1979 = Jan 31, 1979 = Jan 31, 2010 • seasonal data disaggregated to daily, • missing seasons filled in, • adjustment factor PEADJ calibrated to water balance. • Wetter years in southern CBRFC region (e.g., San Juan), or when/where Prcp drives Runoff, we under-forecast Runoff, or over-estimate ET. • Option to use time-series in Sac-SMA, down to six-hourly: • best option is to use observed Ep, • cannot use Epan at a daily or sub-daily scale, • best modeling option is a Penman-based estimate, • heavy on data inputs/parameters. Ep= evaporative demand Epan = pan evaporation Prcp = precipitation
Physically based models: PenPanEpan (synthetic pan evaporation) Qn= energy available for ET U2 = wind speed esat-ea = vapor pressure deficit (~ humidity) IR = infra-red, or long-wave radiation • synthetic measure of evaporative demand to synthesize Epanobservations. • mixture of radiation (sunshine and IR) and drying power of the air (humidity and wind). • accounts for instrumentation effects: • extra sunshine interception by pan walls, • increased turbulence across water surface. Epan for April 25, 2010 (mm)
Preliminary results: climatology of dynamic daily Epan, Ep, and ETrc– Tenmile Creek, CO Ep = 0.7 * Epan
Preliminary results: dynamic Epan vs. historic simulated streamflow errors
Preliminary results: dynamic Epan vs. historic simulated streamflow errors • Concept: • daily simulated streamflow errors are generated from Sac-SMA/SNOW-17 model in RFC operations, running static Ep (i.e., climatologic monthly), • errors are compared to dynamic Epan from a 30-year time-series. • Results: • greatest streamflow errors (+/-) occur with highest Epan at all time-scales to 3-monthly, • relation is less clear at higher time-scales (monsoon and water supply seasons, annual), • highest correlation between monthly error and monthly Epan is March/April. • Caveat: • this is one basin: • Tenmile Creek near Breckenridge, CO • high-elevation headwater basin, • snowmelt-dominated.
Forecasting ETrcacross NWS Western Region: Penman-MonteithETrc Kimberly Penman ETrc • here, ETrc is a specific case of ET calculated for specific biological and physical conditions (a hypothetical reference crop): • well-watered alfalfa/grass of height 0.12 m, rs = 70 sec/m, a = 0.23, rs = 208 sec/m, • uses regularly forecast meteorological data, • international standard (FAO-56). • very commonly used in agricultural community. • adjusts Penman Ep to model seasonality in vapor transfer process through aKP and bKP: • seasonal functions of day of year, • calibrated in Kimberly, ID, • uses regularly forecast meteorological data. ETrc forecast for May 3, 2010 (mm)
Forecasting ETrc across NWS Western Region: delivery concept Wind Temperature Dewpoint Sky cover • Input forecast grids • NDFD-derived • 2.5-km resolution • hourly WFO FORECAST + + + • ETrc climatology grids • NLDAS-derived • 0.125o resolution • CONUS-wide • daily / weekly • moving window / static weeks CBRFC & WR-SSD mean GFE script variance minimum 90% exceedance median (50%) 10% exceedance maximum • ETrc forecast grid • 2.5-km resolution • daily/weekly outlook • ETrcpoint forecast • value-added • statistical context • spatial context WFOPRODUCT e.g., http://www.wrh.noaa.gov/sto/et