Download

1 / 69
690 likes | 864 Views
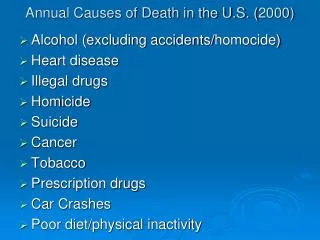
Primary Care and the American Obesity Epidemic Wayne Altman, MD, FAAFP Associate Professor, Department of Family Medicine Director of Medical Student Education, Family Medicine Course Director, Foundations of Patient Care. Actual Causes of Preventable Death.

E N D
Primary Care and the American Obesity EpidemicWayne Altman, MD, FAAFPAssociate Professor, Department of Family Medicine Director of Medical Student Education, Family Medicine Course Director, Foundations of Patient Care
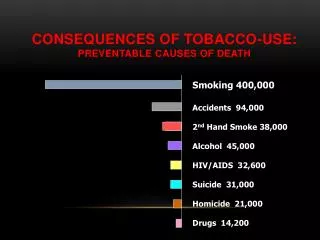
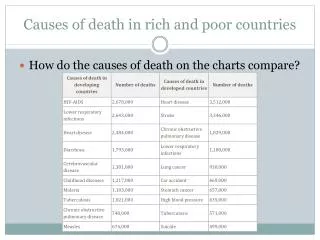
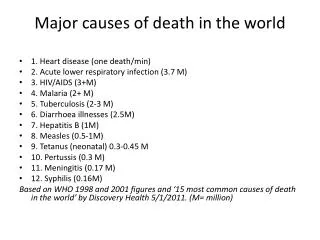
Actual Causes of Preventable Death • Tobacco: ~430,000 deaths per year • Poor diet: ~370,000 deaths per year (and rising) • Alcohol use: ~80,000 deaths per year
Body Mass Index (BMI) • Normal Adult BMI: 18-25 • Overweight: 25-30 • Obese: 30-40 • Morbid Obesity: >40
Obesity Trends Among U.S. Adults 1985 (BMI ≥30) No Data <10% 10%–14%
Obesity Trends Among U.S. Adults 1986 (BMI ≥30) No Data <10% 10%–14%
Obesity Trends Among U.S. Adults 1987 (BMI ≥30) No Data <10% 10%–14%
Obesity Trends Among U.S. Adults 1988 (BMI ≥30) No Data <10% 10%–14%
Obesity Trends Among U.S. Adults 1989 (BMI ≥30) No Data <10% 10%–14%
Obesity Trends Among U.S. Adults 1990 (BMI ≥30) No Data <10% 10%–14%
Obesity Trends Among U.S. Adults 1991 (BMI ≥30) No Data <10% 10%–14% 15%–19%
Obesity Trends Among U.S. Adults 1992 (BMI ≥30) No Data <10% 10%–14% 15%–19%
Obesity Trends Among U.S. Adults 1993 (BMI ≥30) No Data <10% 10%–14% 15%–19%
Obesity Trends Among U.S. Adults 1994 (BMI ≥30) No Data <10% 10%–14% 15%–19%
Obesity Trends Among U.S. Adults 1995 (BMI ≥30) No Data <10% 10%–14% 15%–19%
Obesity Trends Among U.S. Adults 1996 (BMI ≥30) No Data <10% 10%–14% 15%–19%
Obesity Trends Among U.S. Adults 1997 (BMI ≥30) No Data <10% 10%–14% 15%–19% ≥20%
Obesity Trends Among U.S. Adults 1998 (BMI ≥30) No Data <10% 10%–14% 15%–19% ≥20%
Obesity Trends Among U.S. Adults 1999 (BMI ≥30) No Data <10% 10%–14% 15%–19% ≥20%
Obesity Trends Among U.S. Adults 2000 (BMI ≥30) No Data <10% 10%–14% 15%–19% ≥20%
Obesity Trends Among U.S. Adults 2001 (BMI ≥30) No Data <10% 10%–14% 15%–19% 20%–24% ≥25%
Obesity Trends Among U.S. Adults 2002 (BMI ≥30) No Data <10% 10%–14% 15%–19% 20%–24% ≥25%
Obesity Trends Among U.S. Adults 2003 (BMI ≥30) No Data <10% 10%–14% 15%–19% 20%–24% ≥25%
Obesity Trends Among U.S. Adults 2004 (BMI ≥30) No Data <10% 10%–14% 15%–19% 20%–24% ≥25%
Obesity Trends Among U.S. Adults 2005 (BMI ≥30) No Data <10% 10%–14% 15%–19% 20%–24% 25%–29% ≥30%
Obesity Trends Among U.S. Adults 2006 (BMI ≥30) No Data <10% 10%–14% 15%–19% 20%–24% 25%–29% ≥30%
Obesity Trends Among U.S. Adults 2007 (BMI ≥30) No Data <10% 10%–14% 15%–19% 20%–24% 25%–29% ≥30%
Obesity Trends Among U.S. Adults 2008 (BMI ≥ 30) No Data <10% 10%–14% 15%–19% 20%–24% 25%–29% ≥30%
Obesity Trends Among U.S. Adults 2009 (BMI ≥ 30) No Data <10% 10%–14% 15%–19% 20%–24% 25%–29% ≥30%
Obesity Trends Among U.S. Adults 2010 (BMI ≥30) No Data <10% 10%–14% 15%–19% 20%–24% 25%–29% ≥30%
Obesity Trends* Among U.S. Adults1985, 2000, 2010 2000 1985 2010 No Data <10% 10%–14% 15%–19% 20%–24% 25%–29% ≥30%
2015? 2020?
Pediatric Obesity According to the CDC, 1 in 3 American kids born after 2000 will develop diabetes in their life This generation of children is the first generation expected to have a life expectancy shorter than their parents
Culture of Wellness The Cupcake Scandal Pizza and Nachos You need to help reverse this culture
How do primary care doctors get this message across to their patients?
Limited time with individuals is a challenge when trying to care for populations.And, sometimes people do not follow my instructions…which reminds me of my kids…and one of their books…
Mama Called The Doctor And The Doctor Said, “No More Monkeys Jumping On The Bed!”
Four Little Monkeys Jumping On The Bed
Mama Called The Doctor And The DoctorSaid, No More Monkeys Jumping On The Bed!
Mama Called The Doctor And The Doctor Said, No More Monkeys Jumping On The Bed!