Download
1 / 27
270 likes | 352 Views
Explore comprehensive income inequality within classes in the US (1989 and 2000) based on net worth and occupation types. Analyze income sources and Gini indices to understand economic well-being.

E N D
Class Structure and Household Economic Well-Being Ed Wolff Ajut Zacharias Discussant: Stephan Klasen.
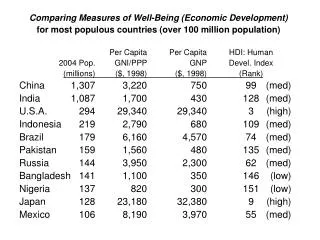
Summary 1 • Purpose of Paper: Investigate inequality within and between „classes“ using comprehensive income measure for US, 1989 and 2000. • Concept of Class: Determination by Net worth, occupational titles, and self-employment: Capitalists (net worth>$5m.), no compulsion to work, five laboring classes (managers, supervisors, white-collar skilled, blue-collar skilled, unskilled), and self.-employed. • Assignment based on CPS, Annual Demographic Supplement matched (nearest neighbour) with SCF to dientify capitalists. Household based but using characteristics of ‚reference person‘. • Comment: Where are workless households? Do these groups have common interests/ agendas/ consciousness? How many capitalists labor?
Summary 2 • Chacteristics of ‚reference person‘ • 88% of capitalists white (73% of non-capitalists) • Gender and age characteristics hard to interpret and contigent on definition of ‚reference person‘ (and not so relevant since is it a household level concept) • Education characteristics as expected (and similar problem as above)
Summary 3 • Derivation of ‚Comprehensive Income‘ measure: • Subtracts consumption taxes • Adds income from wealth (home and non-home) cash and non-cash transfers. Differences to ‚Extended Income‘ (Census Bureau): • Uses annuity value from non-home wealth • Uses imputed rent on owner-occupied housing (minus mortgage payments) • Uses full cost (insurance) value of non-cash transfers
Summary 4 • Total inequality (Gini) decomposition using Ytzaki (1994) framework:
Summary 4 • Inequality and Income Sources: Using CI, capitalists have higher incomes from wealth and that has increased dramatically 1989-2000 • Gini decomposition by income shows rising inequality in CI driven by that (rising inequality in EI driven by contribution from base, i.e. money, income).
Comments • Nice paper, lots of good empirical work, careful data analysis; • Why is class a useful concept (other than history of thought relevance)? (But how useful is quintile?) • Ytzaki decomposition not very intuitive and ‚overlap term‘ a form of between-inequality? • Using Theil decompositions to show that between class term is more significant than other ways to slice the data (e.g. race, region, education) • Earnings versus household income: class based on labor and earnings, then other incomes added. Problem?
Welfare State Expenditures and the Redistribution of Well-Being: Children, Elders, and Others in Comparative Perspective Irwin Garfinkel, Lee Rainwater, Tim Smeeding Discussant: Stephan Klasen.
Summary 1 • Purpose of Paper: Measure redistribution by state including taxes, cash and in-kind benefits in 10 OECD countries. • Accounting Exercise (abstracting from changes in behavior, particularly household formation behavior). • Base data: after tax LIS data (what about income from owner-occupied housing?) • Added: sales, VAT, excise, corporate taxes, government health and education spending (plus employer health provisions in US): Taxes forced to equal expenditures!
Summary 2 • Many details on imputations (mostly reasonable, some open to question) . • Education: only primary and secondary and allocated to households with relevant age children; random allocation of early childhood education. • Health: public spending allocated in age-increasing gradient; US: allocation of employer-provided health care.
Further Results • Elderly net recipients, childless households net payers (but large redistribution within groups) • Average benefits assumption changes redistributive role of government the most for elderly (by construction, main beneficiaries of large health spending in US)
Comments • Nice, careful, and comprehensive study; • High in-kind benefits in US worth as much to recipients? • What is ‚public health‘ spending in Germany (includes employer and employee contribution?) • Tertiary education could (and should) be included using different household surveys (and published work); • Many childless households remain childless (33% in Germany), so permanent not life-cycle subsidy. • P10/P50 among childed households ‚equality of opportunity‘ in sense of Roemer (1998) and WDR (2005)?
Income Inequality Across Regions of Russian Federation (1995-2003) Irina Gerasimova Discussant: Stephan Klasen.
Summary 1 • Purpose of paper: describe inequality trends by regions and income sources from published sources for Russia; • Data: published ROSSTAT aggregate data (some discussion of data inconsistencies with other sources) • Describe Gini and income components by region (78) over time • Generate deciles of regions (7-8 regions each) to generate Gini for total money income and income components
Comments • Nice study highlighting importance of regional inequality, centralitiy of Moscow region, and role of income sources; • Questions about data reliability (and definitions, e.g. ‚other incomes‘) • Within-Russia inequality convergence? • Table 1/Figure 1 should not use ‚maximum Gini‘ from WIID database. • Why first aggregate to regions and then calculate Ginis (throwing away information)? • Clear limits to aggregate data: need to investigate this using micro data (RLMS?) and doing full decompositions. • More clarifications on terms and concepts needed.