
ABSTRACT
Explore the impact of El Nino on hurricanes through GIS analysis, comparing 1997 El Nino season with 2005 neutral season. Discover insights into storm patterns, intensity, and landfall distributions.

ABSTRACT
E N D
Presentation Transcript
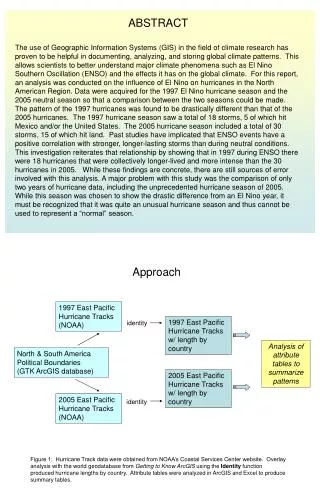
ABSTRACT The use of Geographic Information Systems (GIS) in the field of climate research has proven to be helpful in documenting, analyzing, and storing global climate patterns. This allows scientists to better understand major climate phenomena such as El Nino Southern Oscillation (ENSO) and the effects it has on the global climate. For this report, an analysis was conducted on the influence of El Nino on hurricanes in the North American Region. Data were acquired for the 1997 El Nino hurricane season and the 2005 neutral season so that a comparison between the two seasons could be made. The pattern of the 1997 hurricanes was found to be drastically different than that of the 2005 hurricanes. The 1997 hurricane season saw a total of 18 storms, 5 of which hit Mexico and/or the United States. The 2005 hurricane season included a total of 30 storms, 15 of which hit land. Past studies have implicated that ENSO events have a positive correlation with stronger, longer-lasting storms than during neutral conditions. This investigation reiterates that relationship by showing that in 1997 during ENSO there were 18 hurricanes that were collectively longer-lived and more intense than the 30 hurricanes in 2005. While these findings are concrete, there are still sources of error involved with this analysis. A major problem with this study was the comparison of only two years of hurricane data, including the unprecedented hurricane season of 2005. While this season was chosen to show the drastic difference from an El Nino year, it must be recognized that it was quite an unusual hurricane season and thus cannot be used to represent a “normal” season. Approach 1997 East Pacific Hurricane Tracks (NOAA) 1997 East Pacific Hurricane Tracks w/ length by country identity Analysis of attribute tables to summarize patterns North & South America Political Boundaries (GTK ArcGIS database) 2005 East Pacific Hurricane Tracks w/ length by country 2005 East Pacific Hurricane Tracks (NOAA) identity Figure 1: Hurricane Track data were obtained from NOAA’s Coastal Services Center website. Overlay analysis with the world geodatabase from Getting to Know ArcGIS using the Identity function produced hurricane lengths by country. Attribute tables were analyzed in ArcGIS and Excel to produce summary tables.
Findings Figure 2: Hurricane Tracks from NOAA’s Coastal Services Center website. Left panel shows 1997 hurricanes; right panel shows 2005 hurricanes. Table 1: 1997 Hurricanes summarized by name, country of landfall and landfall distance. Table 2: 2005 Hurricanes summarized by name, country of landfall and landfall distance. Summary • 1997 El Niño hurricane season included 18 storms, 5 of which made landfall in U.S. or Mexico. • 2005 neutral hurricane season included 30 storms, 15 of which made landfall in 9 countries. • 1997 El Niño hurricanes had higher average windspeed, lower average pressure and slightly longer duration, demonstrating the effect of more intense hurricanes during El Niño periods.
The Influence of El Nino on Hurricanes In the North Atlantic Region -- Allison C. Roy --


