Download
1 / 29
290 likes | 385 Views
Explore how Montana's population is shifting unevenly across regions, with a focus on city-centered growth and employment changes in the fast-growing Rockies. Discover past and projected population growth trends in ten sub-regions of Montana and see how employment in different sectors has evolved over the years.

E N D
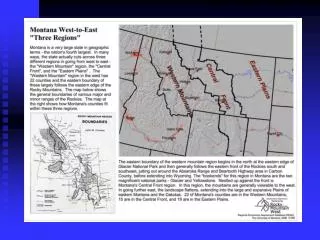
Lop-Sided Population Change in Montana The recent “sea change” in U.S. population migration patterns played out very differently in Montana’s three regions. The 21 Western Mountain counties saw almost all of the increase with net migration shooting to nearly 58,000 in the ‘90s. The Central Front saw some of the increase. The 21 Eastern Plains counties continue to lose population. Population counts through 2003 indicate these trends are continuing. Montana’s population grew by almost 120,000 people between 1990 and 2003, after very little growth in the ‘80s. Over 85 percent of this population growth was the result of net migration. Most of this growth is in the Western Mountain region (green bars), mainly in Gallatin, Flathead, Missoula, Ravalli, Lewis & Clark, and Lake Counties. Some of the growth is in the Central Front (purple bars), mainly in Yellowstone County. In the Eastern Plains (yellow bars), every county except one lost population.
City-Centered Growth in Montana Most Montanans live in or nearby the state’s seven largest population centers. In fact, today, more than 60 percent of the state’s population lives in the seven counties where its major population centers are located. Another quarter of the population live in counties surrounding these regional centers and are closely-linked to these centers economically and socially. Less than 14 percent of the state’s population lives in relatively isolated areas with small populations.
Past and Projected Population Growth among Montana’s Ten Sub-regions The chart shows sub-regional population growth, past and projected, for the ten sub-regions of Montana that are mainly centered around major population centers. The two most populated ones are the Billings sub-region, which will reach 220,000 people by 2025, and the Missoula sub-region, which will increase to over 240,000 people by 2025. The combined population of the 5-county area centered around Missoula will have a larger population than the 10-county area centered around Billings by or shortly after 2010. The populations of the Bozeman and Flathead sub-regions will each reach about 150,000 people by 2025 according to these population projections. The populations of both of these fast-growing sub-regions will move past the population of the more expansive Great Falls sub-region by or before 2015. Population growth in Montana has centered around its main regional population centers, although these are growing are differing rates.
Recent Employment Change in the Fast-growing Rockies and in Montana In the last decade when the economy of the Rocky Mountain West became one of the fastest-growing regional economies in the nation, employment growth in the broad services sector accounted for 37 percent of all new jobs in the region. The top chart shows employment change in the five-state region by major sector over the course of the last twenty years. There are 13 major sectors of the economy and two of these, services and retail trade, now account for nearly half of all employment. The sector with the third highest employment is Finance, Insurance, and Real Estate, or the F.I.R.E. sector, which is followed by manufacturing, construction, and local government (which includes public education). There is a common perception in Montana that the state’s economy is deteriorating, with many citing the growth in service and retail trade jobs and the loss of other “good” jobs in the economy. In actuality, the changing mix of jobs in Montana closely parallels the changing mix of jobs in the larger Rocky Mountain West region; which has seen significant gains in economic performance in recent years. In the last decade while service jobs grew by 37 percent in the fast-growing Rockies, they grew by 42 percent in Montana. And, while services and retail trade now account for nearly half of all jobs in the Rockies, they accounted for 49 percent of jobs in Montana in 2000. When you compare employment trends in Montana with the larger Rocky Mountain region, there are differences. F.I.R.E. is also the fourth highest major sector of employment rather than third as in the Rockies. Manufacturing is seventh, rather than fourth. And farm and ranch employment is sixth in Montana rather than twelfth.
Fast-Growing and Declining Sub- Sectors in Montana Big Changes in the Economy The one constant in the economy, as in life, is change. And change in the economy seems to be accelerating. Different segments of the economy are affected differently by these changes. Some are expanding rapidly, while others decline. There are over 75 individual sub-sectors of the economy. The chart above shows which of these are fast-growing or declining during the decade of the ‘90s – a period of accelerated growth and fairly dramatic economic restructuring. Growth is most heavily focused in a wide range of service sub-sectors – particularly health care, business services, engineering and management services, and social services. Areas of finance, insurance, and real estate, as well as construction also are fast-growing. Only sixteen of the more than 75 sub-sectors of the economy, listed in the top portion of the chart above, accounted for two-thirds of all growth in labor earnings in Montana during the ‘90s. Conversely, decline in the economy is concentrated in an even smaller number of sub-sectors and most are longstanding industries. These include the natural resource industries of mining, logging and wood products, and agriculture. Also included is railroads and the U.S. military, which has been consolidated throughout the West.
Recent Employment Growth Statewide New industry codes were recently instituted for the collection of income and employment data in the U.S. Among other changes, these new codes divide the large services sector under the old SIC codes into 9 separate major services sectors, including health care and social assistance, professional and technical services, accommodation and food services, administrative and waste services, arts, entertainment and recreation services, educational services, management services, and other services. The F.I.R.E. sector has been divided into two major sectors – finance and insurance, and real estate. The chart shows major sectors in Montana by labor earnings in the first quarter of 2001 and four years later in 2005. The sectors are rank-ordered from largest to smallest in the legend. Health care and social assistance is the largest single sector, followed by retail trade and local government.
Recent Sector Level Labor Income Growth in Montana Labor income growth in Montana is most concentrated in three major sectors – health care and social assistance, construction, and retail trade. The fourth and fifth largest growth is in finance and insurance and in professional and technical services. Growth in all of the other 19 major sectors is less than $200 million over the period from first quarter of 2001 through the first quarter of 2005.
Population Change in Montana: 2000 – 2005 Since the 2000 Census, population growth in Montana remains heavily focused in the western portion of the state. As a group the western Mountain counties grew in population by over 33,000 persons. Central Front counties grew by over 5,400 and Eastern Plains counties had an overall loss in population of 5,200. In the West, growth was focused in and around Gallatin County and Bozeman, in the Flathead Valley, and in and around Missoula and Helena. Butte-Silver Bow had continuing population decline and other counties nearby Butte also declined, including Deer Lodge, Beaverhead, and Powell. Along the Front, growth was heavily concentrated in Yellowstone County. All of the counties in the Eastern Plains experienced population losses.
Population Change in Montana: 2000 – 2005, Urban-to-Rural Since the 2000 Census, population growth has concentrated even more in Montana in and around its major regional population centers, including Billings, Missoula, Helena, Bozeman, and Kalispell-Whitefish. The state’s two other regional center counties – Cascade with Great Falls and Silver Bow with Butte – continue to loss population, as do most counties nearby these centers. As a group, the seven regional center counties increased their population by a combined 31,000 people. Counties nearby these regional center counties and closely-linked to them had a combined population increase of 7,600. Isolated rural counties not nearby these centers and primarily located in the eastern portion of the state fell in population by over 5,000 persons.
Helena Area and Surrounding Areas Populations The map shows population distribution at the Census “block” level for Helena and its surrounding area and also for surrounding areas of other major population centers that lie on each side of Helena. The map also identifies the number of persons living within 40 miles of each of these major population centers at the time of the 2000 Census. Nearly 73,000 people reside within 40 miles of Helena and this is the principal population served by businesses and other functions located in and nearby Helena. Billings has the largest population within this 40-mile zone with most of these persons living in Yellowstone County itself. Missoula has the second largest population concentration, with significant numbers within its service area in counties surrounding Missoula County. 2000 Census populations mapped at the Census block level with each dot representing 15 persons. Source: O’Connor Center for the Rocky Mountain West, U. of Montana
Recent Yearly Population Change in Counties Nearby Jefferson County The chart shows population change each year between July of 2000 and July of 2005, which is the latest available data. Jefferson County has seen steady population growth over the entire period, including growth of 307 persons between 2004 and 2005 and 313 persons between 2003 and 2004. The greatest growth in the area is occurring in Gallatin County and this growth has actually accelerated in the last three years. Madison County to the west of Gallatin is now seeing growth. Lewis and Clark County also is experiencing increased population growth. Silver Bow has had population declines in each of these most recent years, combining with longer term losses. And decline also continues in Deer Lodge County. Powell County, on the other hand, had some increase in the last year after previous declines.
Past and Recent Trends in Population Growth in Jefferson County The most recent estimate of Jefferson County’s total population is for July, 2005, at 11,170 people. Less than 8,000 people resided in the county in 1990 and this was up from only 7,075 in 1980. The upper chart shows annual change in the county’s population dating back to the early ‘70s up through 2005. The lower chart shows annual change in percentage terms. The county saw fairly strong growth in the early ‘70s, but this steadily receded in the late ‘70s and early and mid-‘80s, with actual population decline occurring in 1985 and 1986. The area experience a rebound in population growth in the early and mid-‘90s, with the greatest growth in ’94, ’95, and ’96. Growth gradually fell after that but, more recently, has begun to rebound again. In recent years annual growth in population has ranged from 1.3 to 3.0%. It is likely that growth over the next several years or more will range from 2 to 3% a year.
Jefferson Co. Population by Age: 1990 vs. 2000 The population of the U.S. as a whole is aging. This is largely due to the influence of a very large segment of the population born after W.W. II. Baby boomers are now aging and because of their size, this is resulting in fairly dramatic aging of the population overall. Some areas are aging more rapidly than others. Montana is projected to have one of the oldest populations among U.S. states by 2020. The median age of the state’s population has risen from 29 in 1980 to 33 in 1990 and to 38 in 2000. The median age of Jefferson Co. residents has risen from 30 to 35 and to 40 over this same period. The upper chart shows the number of people living in the county by single age for 1990 and ten years later in 2000. The lower chart shows change only in the county’s population by age.
Key Trends in the Jefferson County Area Jefferson County lies between three major cities - Helena to the north, Butte to the south and west and Bozeman to the south and east. Helena is located in Lewis and Clark County which is seeing increased population growth in the last ten years. Bozeman and Gallatin County more generally have become the fastest growing area in Montana. Butte and Silver Bow County on the other hand continue to experience gradual population loss and decline. Jefferson County has no large cities, but has a growing population. The county’s population in 2005 was estimated at nearly 11,200 residents, up from 10,100 in 2000, which was up from less than 8,000 in 1990 and 7,100 in 1980. Jefferson County is 1,659 square miles in size with about 57% of this land area (about 945 square miles) is some form of federal government ownership and management. Most of this is Forest Service land (over 800 square miles) and the rest is BLM land. Growth in Montana has been heavily concentrated in the western portion of the state in recent years and this growth is expected to continue. This growth is being fed by major shifts in population migration patterns, with growth in the Interior West and western Montana more specifically favoring areas with high quality area amenities. This growth is filtering into Jefferson County. Growth in the county also has been spurred by expansion of mining activity.
Past and Projected Population in Jefferson County The chart shows the county’s population as estimated each year since 1980. Estimates for after 2005 are projected using an upper estimate of 3% a year growth and a lower estimate of 2% annual growth. The county’s population grew slowly during the ‘80s, rising from just over 7,000 to just under 8,000 people. However, with a surge in growth in the ‘90s, the population rose to over 10,000 in 2000. Five years later in 2005 the county is estimated to have a population of 11,170 people. So, there was an acceleration in population growth in the ‘90s after fairly slow growth in the ‘80s, and this accelerated growth appears to be continuing. At 2% growth a year, the county’s population will reach 13,600 by 2015 and exceed 15,000 by 2020. At the higher 3% annual growth, the population will rise to 15,000 by 2015 and to over 17,000 by 2020. The lower chart shows what this past and future growth in population looks like by ten-year periods. Estimates for housing growth also are shown in the chart with projected levels of housing based upon recent trends in the ratio of population to housing units in the county.
Past and Projected Housing Units in Jefferson County While population is estimated annually for counties, housing units of all types –occupied, abandoned, owner-occupied, renter-occupied, single-family unit, multi-family, etc. – are estimated only periodically, using in conjunction with the ten-year Census of Population. By comparing the population to the housing unit estimates, a ratio of persons per housing unit was estimated for Jefferson County over time. These ratios are shown in the upper chart. In 1980 there were 2.45 persons per housing unit in the county. This fell to 2.40 in both 1990 and 2000 before rising to 2.58 in 2004 (the most recent estimate). In estimating future housing units for the county, ratios of 2.5 for 2010 and 2.4 for 2020 are used and these are applied to the previous population estimates – high ones estimated at 3% annual growth and low ones estimated at 2% growth. By 2010 the number of housing units in the county would rise from the current level of 4,200 to about 5,000 or more. By 2015 housing units would reach 6,300 to nearly 7,300.
Personal Income Growth by Source in Jefferson Co. Personal income has grown steadily in Jefferson Co. when adjusted for inflation, with much of this growth in labor earnings. Other income sources – investment income (rent, dividends, capital gains, etc.) and transfer payments (primarily Social Security and Medicare/Medicaid benefits) also have grown. The upper chart shows levels for each major income source since 1970 with dollar amounts adjusted for inflation. Labor earnings grew from $119 million in 1990 to nearly $173 million in 2000 and to over $203 million in 2004. These workplace earnings have consistently accounted for over 70% of all income in the county, as shown in the lower chart. In future years as the area population continues to age, it is very likely that both transfer payment income and investment income will begin to grow much more rapidly.
Labor Earnings in Jefferson Co. of Workplace Location – In or Out of County Labor earnings by residents of Jefferson Co. who work come from businesses located both in and out of the county. In 2004 an estimated $136 million came from workplaces located within Jefferson Co. and another $83 million came from workplaces outside of the county. These out-of-county workplace earnings accounted for 38% of all labor earnings by residents of the county in 2004. In the early ‘80s, workplace earnings from outside of the county actually exceeded those received by county residents from workplaces inside the county.
Trends in Per Capita Income Growth in Jefferson Co. The most widely used indicator of area economic well-being in per capita income. The upper chart shows per capita income for Jefferson Co. over time in 2000 inflation-adjusted dollars. In 2004 per capita income was $26,239 and this was up from just under $25,000 in 2000. Per capita income gains are hard-fought and the lower chart shows year-to-year changes in per capita income in the county.
County-Level Variations in Per Capita Income Montana is a geographically and economically diverse state and this diversity is reflected in wide-ranging per capita income levels across the state. Area per capita income is simply total personal income – all income actually received in some form by households or individuals in a given period – divided by the area’s total population – all persons of all ages whose permanent residence is the area in question. The chart at the right shows per capita income levels for each of Montana’s 56 counties in 2003 measured in 2000 inflation-adjusted dollars. The counties are color-coded in the chart with the seven major regional population center counties shown in dark blue, the 27 counties closely-linked to these regional center counties shown in light blue, and the 22 remaining more rural and isolated counties shown in light brown. Statewide per capita income was $24,077 in 2003. All seven regional center counties had higher per capita incomes than the statewide average, and five of these accounted for the top five per capita incomes in the state. Yellowstone County, the state’s most populous county with the state’s largest city, Billings, had the highest per capita income at $27,882. Second was Lewis and Clark (Helena) at $27,000 and third was Missoula County at $26,532. Cascade (Great Falls) was fourth at $26,000 and Gallatin (Bozeman) was fifth at $25,788.
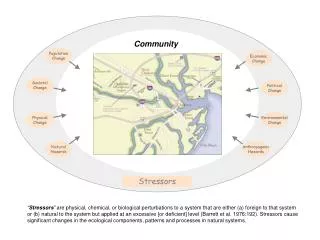
What increasingly really counts in local area economic development in this new economy? The Quality of your community .. infrastructure, schools, neighborhoods, commercial development, streets, parks, arts and cultural amenities, identity, energy, vitality, multi-dimensionality, visual appeal, surrounding environs, … The Quality of your work force .. diverse, appropriately educated, and adaptive with training and education opportunities at all levels and nearby multi-faceted, well-delivered programs in workforce development The Quality of your surrounding environment .. not just parks and attractive, well-planned neighborhoods, downtowns, and commercial districts, but landscapes and natural amenities like streams, lakes, mountains, forests, open spaces, etc. Even though most forces driving larger patterns of change in the economy are supra-community in nature – technological change, transportation developments, new products, major demographic shifts, etc. - so much of what really counts in area economic vitality .. is within the reach of community leaders and decision makers. .. they can help create and sustain the types of positive attributes that attract, nurture, and stimulate economic energy and vitality and the conditions for economic improvement over time.
Lessons to Learn from Emerging Economic Patterns Look Forward Promising strategies for economic improvement must reflect where the economy is going, not where it has been. Customize Strategies Needs and opportunities vary widely from place to place. Goals and strategies must likewise vary. Cities Matter Recognizing that most growth is focusing in and around “city regions,” more attention needs to be focused on the needs of cities as the “settings” if not the “engines” of economic growth, diversification, and advancement. In Montana, we need to assist cities, not deny that we have any. Urban-Rural Relations Matter Pursuing economic development town-by-town or county-by-county is difficult. Influencing local economies sub-region by sub-region with healthy urban-rural partnerships has potential. Become “Learning Communities”Successful businesses are adaptive businesses. Successful communities are adaptive communities. Adaptive communities must be “learning communities,” keeping abreast of change. Think about “Regional Positioning” Local economies can’t be remade by local leaders. What they can do is find ways of better positioning themselves – businesses, schools, work forces, governments, families – for future change. Anticipate future change and position yourself for it. Human-Resource Based Economy The economy is less and less “natural resource based,” and more and more “human resource based.” Do we know how to invest in human resource development? Well-designed, well-funded, adaptive systems for education and work force development are essential for economic prosperity. Environment as a “Key Economic Asset” In the new economy, a quality environment is a key economic asset. Protecting and enhancing environmental qualities is not the enemy of economic development. It is essential for economic prosperity.
Framework for Community and Regional Economic Positioning Pursue Economic Improvement at Sub-State Levels To be successful, economic development initiatives must reflect underlying and emerging area strengths and weaknesses. So, economic development strategies and approaches must vary from place to place. Don’t look for “one-size-fits-all” state-wide approaches. Get your “region” right Pursuing economic development city-by-city or county-by-county is difficult. Influencing area economic conditions and trends in positive ways requires capacity, best achieved at the regional level, by people, businesses, and communities occupying common sub-state economic regions working together. Know that Economic Development is more than Business Development It’s more than business retention, expansion, and sometimes recruitment – all traditional focuses of ED. But it also entails strategic decisions and plans regarding infrastructure and housing, workforce development and education more generally, and area planning. Build Structures and Networks for Public-Private Leadership Interaction and Development Build and nurture a network of people and organizations, cutting across private and public spheres, to sustain discussions about economic development and to sustain efforts and initiatives coming from these discussions. The Big Table Regionally Develop Healthy Urban-Rural, Community-to-Community Partnerships Within real economic regions, the economy does not recognize bounds of urban and rural. It operates across them. Partnerships for area economic improvement also must cross lines of urban and rural, while respecting and recognizing important differences in each. Build around areas of mutual need and benefit. Build trust by working together. Become a “Learning Community” and a “Learning Region” Area economic development is never finally attained. It can only be pursued. It is a constant matter of attempting to position yourself – your businesses, organizations, workers, families, schools, etc. – for future change. Positioning for change requires constant learning, systematically pursued by key area leadership and the larger community. Agree upon a Compelling and Realistic Vision for the Future Imagine where you want to be in the future, taking stock of where you are today and where you were in the past. Visualize what you want your community and region to look like. Identify steps and measures lying between where you are now and where you want to be in the future and pursue them in deliberative, inter-coordinated and sustained ways. Make course corrections as necessary.
Jefferson County Economic and Demographic Assessment • Over the next two to three months, a comprehensive assessment and evaluation will be made of Jefferson County and the Jefferson County area economy under contract with the Jefferson Local Development Corporation. This assessment will include: • Analysis of population growth trends over the last twenty years and growth projections for the next 15 to 20 years, including an assessment of components of population change (net migration versus natural change). • Analysis of past and projected population trends in counties nearby Jefferson. • Analysis of important patterns and trends in area aging of the population, both past and as may be anticipated in the future. • Examination of trends in housing growth and expansion in Jefferson County, past and as anticipated in the future. • Analysis of area income growth by component, including labor earnings, investment income, and income from transfer payments (Social Security, Medicare/Medicaid, etc.). • Analysis of areas of employment growth and decline in the county’s major sectors of the economy and identification of important trends in labor earnings growth among these sectors and key sub-sectors. • Examination of changes and trends in area economic well-being using multiple measures of well-being. • Identification of area and county “peers” for Jefferson County, based upon a characterization of the Jefferson County economy. • Analysis of important comparisons of key trends and conditions in the Jefferson County economy using these peer counties. • Analysis of key issues in economic development and improvement facing the county in the context of its growth and change. • Identification of important elements of a recommended framework for area economic improvement and development decision making.