Download
1 / 11
110 likes | 298 Views
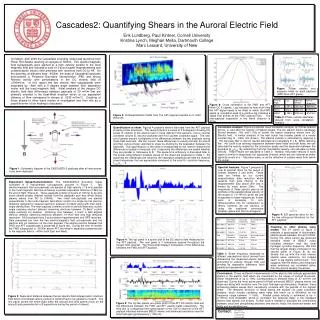
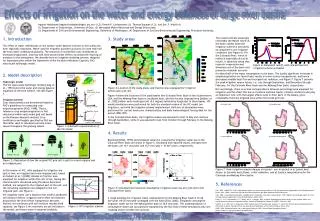
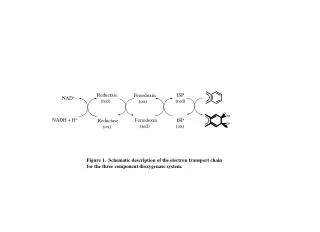
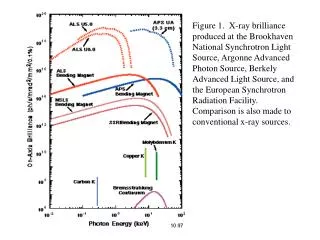
Figure 1. X-ray brilliance produced at the Brookhaven National Synchrotron Light Source, Argonne Advanced Photon Source, Berkely Advanced Light Source, and the European Synchrotron Radiation Facility. Comparison is also made to conventional x-ray sources.

E N D
Figure 1. X-ray brilliance produced at the Brookhaven National Synchrotron Light Source, Argonne Advanced Photon Source, Berkely Advanced Light Source, and the European Synchrotron Radiation Facility. Comparison is also made to conventional x-ray sources.
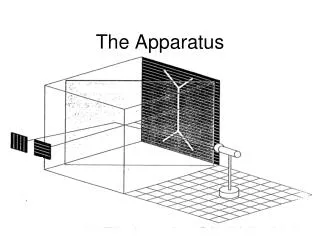
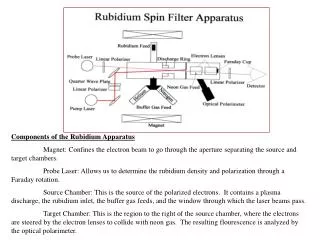
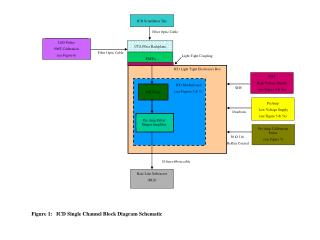
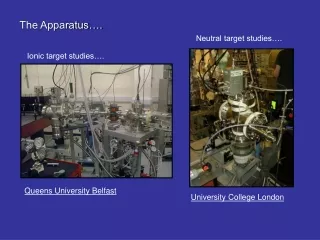
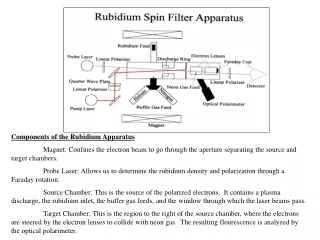
Figure 2. Schematic diagram of the major components in the CMT apparatus used at the BNL X27A bending magnet beam line.
Figure 3. CMT volume of sandy sediments obtained from the New York/New Jersey Harbor.
Figure 4. The distribution of K, Ca, Ti, Mn, Fe, Ni, Cu, and Zn in a 2 m section of a sediment particle from the New York/New Jersey Harbor. 39 × 2 m
Figure 5. Typical sections through a sample of red Vosges sandstone measured at the BNL X27A beam line. The data have been segmented into pore space (white) and solids (black). Figure 5. Typical sections through a sample of red Vosges sandstone measured at the BNL X27A beam line. The data have been segmented into pore space (white) and solids (black).
Figure 6. Two-dimensional correlation functions are shown. They were calculated from the type of data shown in Figure 5.
Figure 7. Results of calculations of porosity, conductivity, and porosity vs. conductivity for the red Vosges sandstone sample are shown for different size data blocks extracted from the complete volume.
Figure 8. CMT sections taken through samples of Darley Dale sandstone in the native state (left) and following compaction at 4.5% axial strain (right). Changes in the grain structure are clearly revealed.
Figure 9. Sections through Berea sandstone are shown for it in its native state and in a compacted state following shock compaction.
Figure 10. Tomogram obtained at the NSLS. It shows the three-dimensional distribution of Wood’s metal in the sample. The spatial resolution is not sufficient to reveal the pathways between the observed filled pores.
Figure 11. APS tomogram showing the Woods metal percolation front. The right-hand picture shows a vertical section through the block shown on the left. The sandstone grains are not shown in this display.