Download
1 / 8
80 likes | 299 Views
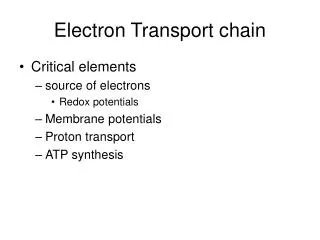
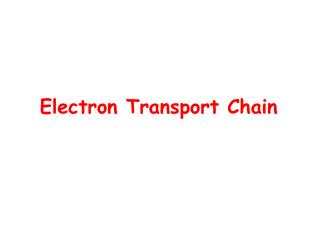
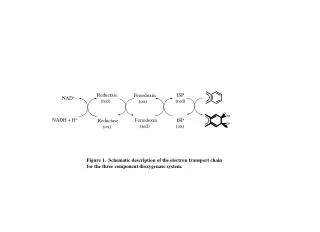
ISP (red). Reductase (red). Ferredoxin (ox). NAD +. ISP (ox). Ferredoxin (red). NADH + H +. Reductase (ox). Figure 1. Schematic description of the electron transport chain for the three component dioxygenase system. NADH + H +. NAD +. XylMA. H 2 O. O 2.

E N D
ISP (red) Reductase (red) Ferredoxin (ox) NAD+ ISP (ox) Ferredoxin (red) NADH + H+ Reductase (ox) Figure 1. Schematic description of the electron transport chain for the three component dioxygenase system.
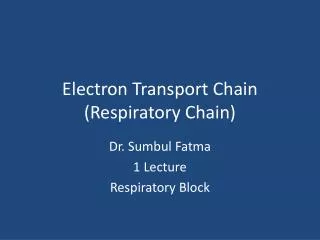
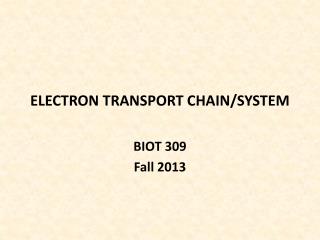
NADH + H+ NAD+ XylMA H2O O2 O2 H2O NAD+ NADH + H+ NahG Figure 2. The reaction catalyzed by xylene monooxygenase and salicylate hydroxylase
Table 2. Growth characteristics of growth B1 and EK504 on aromatic compounds Biphenyl Naphthalene Phenanthrene m-xylene m-toluate + + + + + B1 EK504 - + + + + (Adapted from Kim and Zylstra, 1999) + : growth - : no growth
Table 4. Growth characteristics of growth B1 and EK504 on various aromatic compounds 3-methyl salicylate 4-methyl salicylate Naphthalene 5-methyl salicylate Salicylate + + + + + + B1 - - - - - EK504 + : growth - : no growth
a Rt (min) on GC Compound Prominent ions (m/z, relative intensity %) 268 (M+, 31), 253 (9), 180 (9), 165 (6), 149 (5), 73 (100) 3-methylcatechol 12.82 268 (M+, 39), 253 (12), 180 (10), 165 (7), 149 (5), 73 (100) 3MS metabolite 12.85 4-methylcatechol 12.65 268 (M+, 44), 253 (7), 180 (9), 165 (5), 149 (5), 73 (100) 4MS metabolite 12.65 268 (M+, 41), 253 (7), 180 (7), 165 (5), 149 (5), 73 (100) 5MS metabolite 12.65 268 (M+, 48), 253 (8), 180 (10), 165 (5), 149 (5), 73 (100) :retention time a Rt Table 5. Structural identification of metabolites formed during the incubation of recombinent E. coli strains in the presence of 3-methyl salicylate (3MS), 4-methyl salicylate (4MS) and 5-methyl salicylate (5MS)
NahG P. putida NCIB9816 (unpublished [Genebank assession number X83926] SH P. putida PpG7 (You et al., 1991) TcbAa Pseudomonas sp. P51 (Van der Meer et al., 1991) Sal P. putida S-1 (Suzuki et al., 1996) SH Sphingomonas sp. AJ1 (unpublished [Genebank assession number AB000564] DxnA1 Sphingomonas sp. RW1 (Armengaud et al.,1998) SH P. putida KF715 (Lee et al., 1996) OhbB p. aeruginosa 142 (Tamara et al., 1999) Orf10 Shingomonas sp. BN6 (Klein et al., 1996) BphA1c S. aromaticivorans F199 (Romine et al., 1999) NahG P. fluorescens (Min et al., 2001) BphA1c S. yanoikuyae B1 BphA Burkholderia sp. LB400 (Erickson et al., 1992) BphA1 Pseudomonas sp. B4 ( unpublisd [Genebank assesion number U95064] 200 150 100 50 0 Percentage of divergency Figure 12. Dendrogram showing the level of divergency between the deduced amino acid sequences of different subunits of aromatic dioxygenases and salicylate hydroxylases. The dendrogramwasconstructed with DNASTAR. Each reference is shown in the parenthsis.
BphA2d S. aromaticivorans F199 (Romine et al., 1999) Sal P. putida S-1 (Suzuki et al., 1996) OhbA P. aeruginosa 142 (Tamara et al., 1999) Orf9 Sphingomonas sp. BN6 (Klein et al., 1996) BphA2c S. yanoikuyae B1 BphA2c S. aromaticivorans F199 (Romine et al., 1999) DxnA2 Sphingomonas sp. RW1 (Armengaud et al.,1998) SH P. putida PpG7 (You et al., 1991) NahG P. putida NCIB9816 (unpublished,[Genebank assession number X83926] SH P. putida KF715 (Lee et al., 1996) NahG P. fluorescens (Min et al., 2001) TcbAb Pseudomonas sp. P51 (Van der Meer et al., 1991) SH Sphingomonas sp. AJ1 (unpublished,[Genebank assession number AB000564] 200 150 100 50 0 Percentage of divergency Figure 13. Dendrogram showing the level of divergency between the deduced amino acid sequences of different subunits of aromatic dioxygenases and salicylate hydroxylases. The dendrogramwasconstructed with DNASTAR. Each reference is shown in the parenthsis.
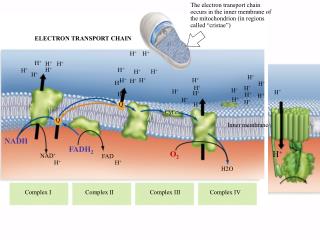
NADH + H+ NAD+ TCA cycle Reductase BphA4 catechol naphthalene Ferredoxin BphA3 Salicylate Oxygenase BphA1cA2c H2O Dioxygenase O2 O2 cis- 1,2- dihydro-1,2- dihydroxynaphthalene salicylate