Download
1 / 30
300 likes | 327 Views
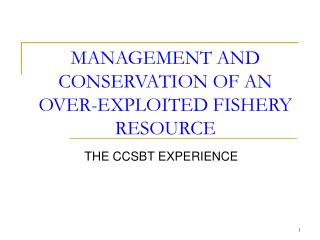
Understand the biological & economic principles governing fish stock sustainability & optimal fishing effort. Explore static & dynamic models, sustainable yield, and policies for efficient resource management.

E N D
The Fishery Resource: Biological and Economic Models Wednesday, April 12
G S S The Biological Model Note: This is a static model in the sense that only one stock size can exist at a time. POPULATION GROWTH (change in stock size) FISH STOCK or POPULATION
C S S To maintain a particular population, catch rate (C) cannot exceed growth rate (G). GROWTH or CATCH RATE STOCK or POPULATION
Steady-state population – with no human impact MSY Smsy Sss Maximum Sustainable Yield – the largest catch rate that can be sustained without reducing fish stock. GROWTH or CATCH RATE STOCK or POPULATION
GROWTH or CATCH RATE FISH YIELD FISH STOCK or POPULATION FISHING EFFORT Zero fishing effort means maximum (steady-state) population Impact of fishing effort on the fish stock:
YE1 C1 e1 Relationship between population, effort and catch Growth/Catch 0 Population Fishing Effort Catch per unit of effort is proportional to population
YE2 C2 YE1 e1 e2 Relationship between population, effort and catch Growth/Catch C1 0 Population Fishing Effort Catch per unit of effort is proportional to population
YE3 YE1 C3 e1 e3 Relationship between population, effort and catch Growth/Catch YE2 C2 C1 e2 0 Population Fishing Effort Catch per unit of effort is proportional to population
Sustainable Yield Function YE3 YE1 e1 e3 Relationship between population, effort and catch Growth/Catch YE2 C2 C3 C1 e2 0 Population Fishing Effort Catch per unit of effort is proportional to population
MSY Sustainable Yield Function Fish Yield Fishing Effort (e.g. number of boats)
Total Revenue = PRICExYIELD = PxQ Sustainable Total Revenue Function Fish Yield x Price TR Fishing Effort (e.g. number of boats)
Total cost = cost per boat x number of boats $ TC TR Fishing Effort (e.g. number of boats)
The Economic Model – what is the economically efficient level of effort? $ Where TR – TC is the greatest. TC TR Fishing Effort (e.g. number of boats)
Review: What does maximum net returns (TR-TC) say about MR and MC? MC is the slope of the TC curve. MR is the slope of the TR curve
Ee The Economic Model – what is the economically efficient level of effort? $ Point of Tangency – where MC=MB TC TR Fishing Effort (e.g. number of boats)
Static Efficiency • MB=MC • TR exceeds TC by the largest amount • Resource owner earns rent • Each year is independent • Yield is sustainable • Discount rate=0
Growth/Catch $ TC TR e* 0 Population Fishing Effort Equilibrium Population
Dynamic Efficiency • If discount rate is greater than zero (e.g. opportunity cost of capital invested in boats and equipment) • Will want to increase effort and catch in current period • Higher catch rate leads to lower population, lower future catch rates • Future equilibrium possible at lower population and lower catch rate
Growth $ TC TR r=0 r>0 0 Population Fishing Effort
What if discount rate is infinitely large? • Future is totally discounted (there may be no future) • This is the open access situation • No limits to access • Other fishers observe rents being earned and enter the fishery • Catch continues until TR=TC (zero rent)
TC Technological change – lowers cost of fishing effort, increases pressure on fishery, further reduces population $ TC TR Fishing Effort (e.g. number of boats)
Growth $ TC TR 0 Population Fishing Effort
Policies to limit fishing effort • Territorial use rights in fisheries (TURF) • Limited entry • Limited effort • Catch limits – total allowable catch (TAC) • Individual fishing quotas (IFQ) • Individual transferable quotas (ITQ) • Marine Reserves • Demand reduction/price signals
TURF • Creates ability to exclude use • Common property management rules • Have existed for centuries • Migratory species an issue • 200 mile Exclusive Economic Zone (EEZ)
Limited Entry • A limited number of “fishing licenses” is issued • May have problem of “capital stuffing” • Making licenses tradable improves efficiency • Transferability of property rights
Limited Effort $ • Season restrictions • Gear restrictions • Limited number of boats • All of these raise the costs of fishing TC TR Fishing Effort Limiting one kind of effort doesn’t eliminate incentives to increase effort elsewhere
Total Allowable Catch • Allowable catch is established and monitored • When allowable catch is reached, fishery is closed • Goal is sustainability, not efficiency • Derby fishery • No quotas for individual fishers • Bigger boats, crews, nets, etc.
Individual Fishing Quotas • Desired total catch is allocated among fishers, with each fisher given a quota • Will solve the race for fish problems • Will not reach efficiency
Individual Transferable Quotas • Individual fishing quotas are transferable • Fishing “rights” go to highest value • Modeled after tradable permits or cap and trade programs in environmental policy • Harvest permits vs. property rights • Issues: • How to allocate quota shares • Community impacts • Concentration of permits • Political opposition
Summary • Most fishery policy has sought to limit harvest in order to prevent collapse of the fish stock • Economics helps understand how different policies affect behavior (incentives) • ITQs begin to address efficiency issue