Break-even
Break-even. http://tutor2u.net/business/gcse/finance_breakeven.htm L:BUSINESSGCEUnit 2Break even point.xls. Break-even is the output level where total costs equal total revenue.

Break-even
E N D
Presentation Transcript
Break-even http://tutor2u.net/business/gcse/finance_breakeven.htm L:\BUSINESS\GCE\Unit 2\Break even point.xls
Break-even is the output level where total costs equal total revenue. Break-even analysis is a technique used to estimate, on purely financial costs and revenue basis, the number of units which must be produced and sold for a project to break-even.
With this simple technique, a manager can calculate the effect of different marketing strategies and different pricing strategies on the business.
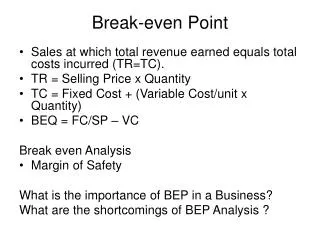
Revenue = Total cost The break-even point is where total costs equal total revenue: in other words, no profit is being made and no loss is being incurred. The break-even point gives a business an initial target at which to aim.
Break-even does not specify a time that it will take to reach this level. This will depend on how quickly sales are generated.
In some cases it can be many years before a firm would reach its break-even sales level. A bank or other investor will almost certainly want to see break-even information.
To work out break-even we need to know various bits of information: • The price you are charging • The variable costs (direct costs) of each unit, these are the costs that change as the level of output changes and will be; raw materials, labour and so on that can be directly attributed to each unit. • The fixed costs (or indirect costs/overheads) - these are the costs that stay the same whatever the level of output and will be things like rent, marketing costs, admin costs and so on. Once we have this information, we can work out the break-even level of output. Let's look at an example:
Worked example Dragon Shirts Ltd, based in Bridgend manufacturing men’s shirts. It has a factory which has a maximum output of 70,000 shirts a year.
Step 1 • Selling price per sheet - £20 • Variable cost per shirt - £10 • Total fixed cost per year - £400,000
Choose an appropriate scale for your diagram Maximum Quantity=70,000 units
Step 2 Draw the fixed cost line on the graph. Fixed costs
Step 3 – Add the Total Cost line Total costs are fixed costs plus variable costs. £400,000 + (70,000 x £10) = £1,100,000
Step 3 Fixed costs + Variable costs £400,000
Step 4 Add the total revenue curve to the graph. Total revenue for 70,000 shirts. 70,000 x £20 = £1,400,000
Maximum revenue is £20 X 70,000 (shirts) = £1,400,000
Step 5 • Identify the break-even point where the total revenue line crosses the total cost line. • Identify the margin of safety
Calculating break-even point Break-even occurs when fixed costs and variable costs are covered by the revenue from units sold. This depends on how much is made on each unit sold
Shirts are sold for £20. The variable costs are £10. £20 - £10 = £10 Each shirt sold will provide £10 which can be used to cover fixed costs. Once fixed costs are covered each sale will contribute £10 towards profit.
The equation Total Fixed costs = Break-even point Contribution per unit £400,000 = 40,000 shirts £10