Analysis of Gene Expression Profiles in Immune Cells
Investigating cell-specific differences in gene expression profiles of monocytes, macrophages, and dendritic cells. Experimental setups and findings from IPA to study immune cells. Workshop held in 2007 by Helena Ahlfors from Turku Centre for Biotechnology. Conclusions and pathways analyzed in the study. Another study on BCR-dependent signaling network perturbations discussed.

Analysis of Gene Expression Profiles in Immune Cells
E N D
Presentation Transcript
Using IPA to study immune cells CSC workshop on Pathway Analysis Espoo, November 12, 2007 Helena Ahlfors Turku Centre for Biotechnology
Lehtonen & Ahlfors et al. Journal of Leukocyte Biology, 2007
Aim of the study • Identification of cell-type specific differences in gene expression profiles of monocytes, macrophages (Mf) and dendritic cells (DCs)
Experimental setting Buffy coat Gene expression profiling with Affymetrix HG-U133A arrays Ficoll gradient Percoll gradient depletion of T and B cells Macrophage GM-CSF GM-CSF + IL-4 Monocyte Dendritic cell
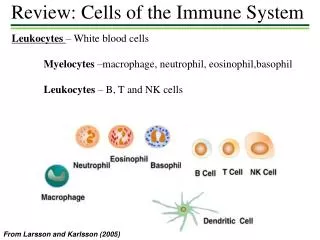
Monocyte 3d Mf 3d DC 7d Mf 7d DC CD14 CD1b DC-SIGN=CD209 Known Mf and DC markers
Monocyte Number of regulated genes 0d 3d 7d Dendritic cell + GM-CSF, IL-4 405376 824342 + GM-CSF Macrophage Filtering criteria:not NCnot AASLR ≥ 1reproducible differences 441265 733389
Genes regulated both at 3-d and 7-d time point * 76120 354236 342194 * Mf vs DC
C3 TCF7L2 FcgR1A 1.0 0.6 0.2 30 20 10 1 0.1 0.01 SOCS1 TGFa FceR1A 10 8 6 4 2 16 12 8 4 20 15 10 5 WNT5A FZD2 100 80 60 40 20 6 4 2 Mo Mf DC Mf DC Mo Mf DC Mf DC Mo Mf DC Mf DC 3d 7d 3d 7d 3d 7d Validation of the expression of a selected set of genes by quantitative RT-PCR
IPA / Canonical pathways Mf DC
Conclusions I • GM-CSF and IL-4 regulate the expression of almost 900 genes during the differentiation of macrophages and DCs. • Altogether 196 genes were differentially regulated in macrophages and DCs throughout the 7-day differentiation. • Most of these genes code for factors involved in the signaling from cell surface to nucleus. • Several novel genes with unknown molecular function were identified. These genes may cooperate with the previously known differentiation promoting factors and thus have an essential role in macrophage and DC differentiation process. • Ingenuity Pathways Analysis revealed that canonical pathways of particular interest are differentially regulated in macrophages and DCs.
Aim of the study • Examine how the BCR-dependent intracellular signaling network adapts to targeted perturbations induced through siRNA-mediated depletion of select signaling intermediates.
mock B cell CaMKII Pyk2 PLCγ PKCδ Experimental setting Transfecting the cells with siRNA oligos Stimulating the cells with anti-IgG for 30 min Gene expression profiling with Illumina mouse-6 beadchips
Array results 210 mock 2255 PLCγ 930 CaMKII 350 Pyk2 449 PKCδ Filtering criteria:SLR ≥ 1reproducible differences
Pyk2 CaMKII mock PLCγ PKCδ IPA / network 1 Network 1:Cancer,Cell cycle,Skeletal and Muscular Disorders
Conclusions II • The depletion of any given component from the BCR signaling network resulted in significant alterations in phophorylation profiles of the other intermediates. • This effect was not localized but extended over to intermediates that were not within the canonical signaling pathways to which each of the depleted molecules belonged. • The depletion of individual nodes also reflected alterations in signal processing with corresponding alterations in the cellular phenotypic response as several tens of genes were either strongly induced or downregulated. • The most significant gene regulatory network identified by IPA was a Myc-centric network with a proposed function in cell cycle regulation.
Acknowledgements Turku Centre for Biotechnology Prof Riitta Lahesmaa International Centre for Genetic Engineering and Biotechnology (ICGEB), Delhi, India Prof Kanury V.S. Rao Dhiraj Kumar Ravichandran Srikanth National Public Health Institute Prof Ilkka Julkunen Anne Lehtonen Ville Veckman Minja Miettinen Finnish Microarray Centre Miina Miller Päivi Junni Tiia Heinonen National Graduate School of Informational and Structural Biology