Download
1 / 22
220 likes | 360 Views
Big Data and the City Jan Piotrowski Online science and technology editor, The Economist iCity ‘ Building a Smarter London ’ breakfast briefing June 19 th 2013. How big is big data? . <1 million. A. Vinberg, Microsoft. engineering software taxonomy. <1 million.

E N D
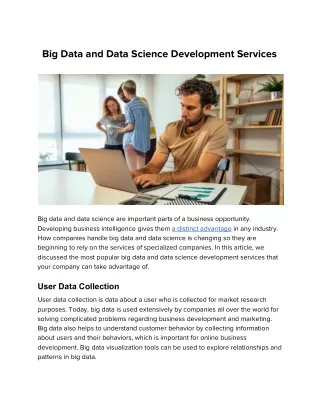
Big Data and the City Jan Piotrowski Online science and technology editor, The Economist iCity ‘Building a Smarter London’ breakfast briefing June 19th 2013
<1 million A. Vinberg, Microsoft
engineering software taxonomy <1 million A. Vinberg, Microsoft
engineering software taxonomy <1 million trillion trillion A. Vinberg, Microsoft
engineering software taxonomy physics chemistry <1 million trillion trillion A. Vinberg, Microsoft
engineering software taxonomy physics chemistry ? <1 million trillion trillion trillion A. Vinberg, Microsoft
economy medicine psychology sociology engineering software taxonomy physics chemistry <1 million trillion trillion trillion A. Vinberg, Microsoft
A lot of information MIT Technology Review Business Report “Big Data gets personal”, May 2013
1. Singapore taxis • 16,000 cabs • 1 month • 500m data points
1. Singapore taxis Aslam et al, 2012
1. Singapore taxis http://xiaoji-chen.com/blog/2011/isochronic-singapore/ Chen et al, 2010
1. Singapore taxis • LIVE Singapore! by MIT SENSEable City Lab senseable.mit.edu/livesingapore/
1. Singapore taxis • LIVE Singapore! by MIT SENSEable City Lab senseable.mit.edu/livesingapore/ • Raining taxis (matching supply and demand) • Urban heat islands (electricity use and temperature) • Formula 1 city (activity during big events) • Real-time talk (everyday activity) • Hub of the world (port and airport links)
2. New York building safety • “illegal conversions”: cutting up a dwelling into smaller units • 25,000 complaints a year • 200 inspectors
2. New York building safety • 900,000 property lots • data from 19 agencies: • property taxes, foreclosures, utility service cuts, type of building, its age, ambulance visits, crime rates, rodent complaints, external brickwork permits • compared against 5 years’ worth of fire data (ranked by severity)
2. New York building safety • Prior to big-data analysis: 13% of inspected properties warranted “vacate orders”
2. New York building safety • Prior to big-data analysis: 13% of inspected properties warranted “vacate orders” • After big-data analysis: 70%
3. Abidjan bus routes • Orange released 2.5 billion call records from 5m mobile-phone users in Ivory Coast (Dec 2011-April 2012) • 539 large buses are supplemented by 5,000 mini-buses and 11,000 shared taxis • call records from about 500,000 phones
3. Abidjan bus routes Current routes (pink) and proposed new routes Calabrese et al, 2013
3. Abidjan bus routes Mobile phone “traces” are accurate enough to serve as a guide to larger population movements: • credit histories • emerging ethnic conflicts • rescue/aid in the wake of natural disasters
Thank you <JanPiotrowski@Economist.com>