Combating Zone Creep with Big Data: Insights from the USDA Plant Hardiness Zone Map
This presentation explores the phenomenon of "zone creep" in agriculture, highlighting how climate change affects plant adaptability across regions. With a focus on the USDA Plant Hardiness Zone Map, it discusses how new data from nearly 8,000 weather stations has transformed our understanding of plant and crop viability. The integration of Big Data and Long Data enables farmers and agricultural professionals to better grasp evolving ecosystems and pest challenges. As climate zones shift, leveraging this data allows for informed decision-making, fostering a resilient agricultural sector.

Combating Zone Creep with Big Data: Insights from the USDA Plant Hardiness Zone Map
E N D
Presentation Transcript
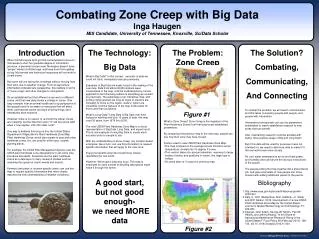
Combating Zone Creep with Big Data Inga Haugen MIS Candidate, University of Tennessee, Knoxville, SciData Scholar Introduction The Technology: Big Data The Solution? Combating, Communicating, And Connecting The Problem: Zone Creep When this Minnesota farm girl first contemplated a move to Tennessee to start her graduate degree in information sciences, a personal concern was Tennessee doesn’t have “proper” winter to kill the bugs, and keep them from getting so big. My learned and instinctual responses will not work in a new biome. But some folk are facing this challenge without moving from their land, due to weather change. From an agriculture information professional’s perspective, this matters in terms of "zone creep" and other changes to ecosystems. It's an established fact that different crops work in different zones, and that new data shows a change in zones. One easy example from an animal health and crop perspective is that people need to be aware of new pests that will affect them, and become aware old ways of doing things don't necessarily work anymore. However, there is no reason to re-invent the wheel. Zones are creeping, but the data from zone “X” will be just as valid when it now applies 250-430 miles north1. One way to address this issue is thru the United States Department of Agriculture’s Plant Hardiness Zone Map. Plant Hardiness Zones, which also equate to pest and critter hardiness zones, too, are used for other uses, outside planting plants. For example, the USDA Risk Management Agency uses the USDA plant hardiness zone designations to set some crop insurance standards. Scientists use the plant hardiness zones as a data layer in many research models such as modeling the spread of exotic weeds and insects. Farmers (and place or location specific users) can use this map to request specific information that more closely matches the new understanding of weather conditions. What is Big Data? In this context, amounts of data we could not track, manipulate and use previously. Examples of Big Data are easily found in the making of the new map. Data from almost 8,000 stations were incorporated in the map, and the multidisciplinary, human approach to fact checking outliers is something we couldn’t do previously. The advantage of an interactive map, with printing rights granted (as long as logos of creators are included) to focus on the region, state or nation are incredible. And the features of the map online allow for more uses than just plants. What is Long Data? Long Data is Big Data over time. Instead of working with only 13 years of data, this map used 30 years, from 1976 thru 2005. The new USDA Plant Hardiness Zone Map is a visual representation of Big Data, Long Data, and expert input2. This is one example of using Big Data to create more accurate tools for people to use. With the understanding of Zone Creep, any location-based enterprise, like a farm, can use this information to request specific information that will apply to the new zone. Everyone benefits when the model more closely resembles the real world. However: We’ve got a long way to go. This map is employed for uses outside of deciding what plants might make it through the winter. To combat the problem, we all need to communicate, and that takes connecting people with people, and people with information. Information professionals can use the parameters established to match established research to new areas that can benefit. Also, maintaining research could be avoided with better, more precise usage of Big and Long Data3. But if this data will be used for purposes it was not intended for, we need to add more data to make it fit the real world even more closely. Air, soil, water temperatures at low and high peaks, and humidity and rain fall are the obvious next pieces of the puzzle. The people putting the map together did a phenomenal job, and gave a template of how people can move forward with adding additional pieces to the puzzle. Figure #1 • What is Zone Creep? Zone Creep is the migration of the Plant Hardiness Zones from their previously established parameters. • By comparing the previous map to the new map, people can see how their zone may have moved. • Factors used in new USDA Plant Hardiness Zone Map: • The map is based on the average annual minimum winter temperature, divided into 10-degree F zones. • This version takes into account elevation, nearness to large bodies of water, and positions in terrian, like ridge tops or valleys • 30 years data vs 13 years for previous map A good start, but not good enough- we need MORE data Bibliography • http://www.nasa.gov/topics/earth/features/growth-shift.html • Daly, C., M.P. Widrlechner, M.D. Halbleib, J.I. Smith, and W.P. Gibson. 2012. Development of a new USDA Plant Hardiness Zone Map for the United States. Journal of Applied Meteorology and Climatology, 51: 242-264 • Sparger, John Adam, George W. Norton, Paul W. Heisey, and Jeffrey Alwang. “Is the Share of Agricultural Maintenance Research Rising in the United States?” Food Policy 38 (February 2013): 126–135. doi:10.1016/j.foodpol.2012.11.004. Figure #2