Download
1 / 24
250 likes | 364 Views
Explore the fundamentals of perfusion imaging using dynamic contrast MRI, including techniques, parameters, and processing methods. Understand how to measure blood flow, volume, and transit time in different vascular structures. Learn about common MR approaches and challenges in perfusion studies.

E N D
Basics of Perfusion Imaging With Dynamic Contrast MRI Larry Panych, PhD Brigham and Women’s Hospital
Contents What is perfusion and why do we care about it? How can it be measured and what are the parameters? What MR approaches are used in perfusion studies? How is dynamic contrast data processed?
Perfusion is the steady state delivery of blood to the tissue
Elastic Arteries • Large arteries close to the heart • Expand and recoil with changes in blood volume • Relatively inactive in vasoconstriction • Can be viewed as simple elastic tubes • Muscular Arteries • Medium and smaller arteries • Less elastic, more smooth muscle • more active in vasoconstriction • distribute blood to specific organs • Arterioles • Lumen diameter less than .5mm • Coils of smooth muscle • Constriction/dilation controls flow of blood to capillary bed • Capillaries • Blood cells flow in single file • Average length is 1mm and diameter .01mm • Provide access to all cells in the body • Exchange materials between blood and interstitial fluid
Much of pathology begins at the cellular and tissue level and is not accompanied by changes in macroscopic blood flow
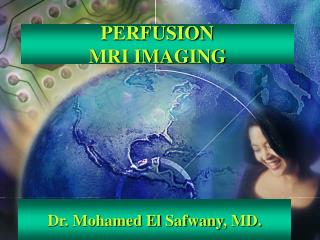
Some methods to image perfusion PET SPECT CT MRI
MRI Perfusion Methods Bolus Tracking (T1 and T2) Steady State Techniques Arterial Spin Labeling
Perfusion Parameters Blood Flow (ml of blood/gm of tissue/sec) Blood Volume (ml of blood/gm of tissue) Mean Transit Time (MTT) (sec) V = F MTT
Bolus injection of paramagnetic agent (Gd) Contrast agent injected into vein Lung Arm Heart
Susceptibility Gradient Intra-voxel static dephasing (DT2*) Contrast Agent Particles Blood Vessel Figure from Cerebral MR Perfusion. Sorensen and Reimer Intra-voxel Incoherent motion (DT2)
Intra-voxel Spin Motion Random or very Intelligently Designed??
Signal loss depends on vessel size and type of scan Spin-echo sequences are more selective for small vessels because diffusion effects dominate for smaller vessels. Figure from Cerebral MR Perfusion. Sorensen and Reimer Voxel close to large vessel sees little field variation voxel close to small vessel sees large field variation
Change in MRI signal due to passage of contrast agent Figure from Cerebral MR Perfusion. Sorensen and Reimer • Arrival time • Maximum contrast concentration • Full-width at half maximum • Pre-injection baseline • Contrast arrival • Peak signal change • Recirculation • Post-injection baseline
Conversion of signal-vs-time to concentration-vs-time C(t) = -k/TE ln(s(t)/so) Figure from Cerebral MR Perfusion. Sorensen and Reimer
Indicator Dilution Theory Assume a known amount of tracer is injected in a volume and flow is constant. The flow can be measured by monitoring the concentration, C(t), at the output of the volume. Flow = A / C(t) dt where A is total amount of agent injected. Tracer in Tracer out Figure from Cerebral MR Perfusion. Sorensen and Reimer
Indicator Dilution Theory Units: A, mmol C(t), mmol/ml F, ml/sec C(t) Dt A = C(Dt) F Dt + C(2Dt) F Dt + …. C(nDt) F Dt + … A = F C(t) dt or F = A / C(t) dt
Differences in Dynamic Contrast MRI • don’t know how much goes into each voxel • the injection is not instantaneous • don’t monitor concentration at output • flow may not be uniform in voxel
Indicator Dilution Theory Applied to DC-MRI CA(t), Arterial Input Function Units: CV, mmol/gm CA (t), mmol/ml F, ml/gm/sec Dt CV ( Dt) = CA( Dt) R1 F Dt CV (2Dt) = CA(2Dt) R1 F Dt + CA (Dt) R2 F Dt … CV (nDt) = CA(nDt) R1 F Dt + … CA(Dt) Rn F Dt Rn, Fraction of contrast agent remaining in the tissue VOI where R1 = 1.
Indicator Dilution Theory Applied to DC-MRI CV ( Dt) CV (2Dt) CV (3Dt) … CV (nDt) CA( Dt) CA(2Dt) CA( Dt) CA(3Dt) CA(2Dt) CA( Dt) CA(4Dt) CA(3Dt) CA( 2Dt) … CA(nDt) CA((n-1)Dt) … CA( Dt) R1 R2 R3 … Rn 0 F = CV = F CA R Solve for FR. F = max of FR. V = F S R
CV = F CA R. How to solve for FR? One method: Get pseudo-inverse of CA. SVD truncation threshold can be set arbitrarily or by optimizing ‘goodness’ parameters.
B: SVD Threshold = 0.050 A B C A: SVD Threshold = 0.015 C: SVD Threshold = 0.200
Getting an Arterial Input Function MCA MCA Pre-injection scan Post-injection – at peak signal change
Getting an Arterial Input Function Very difficult to get a curve that truly represents the concentration of the contrast agent in the vessel. This is a major factor in limiting the ability to absolute perfusion measures.
Other Issues for Quantitative Perfusion Even if a good concentration curve can be obtained, the arterial input function measured at the large artery does not represent the true arterial input to the voxel. There is possibly delay and dispersion of the AIF. Obtaining absolute quantitative perfusion measures requires knowledge of a number of physiological parameters that can not be determined with great accuracy.