Download
1 / 26
280 likes | 593 Views
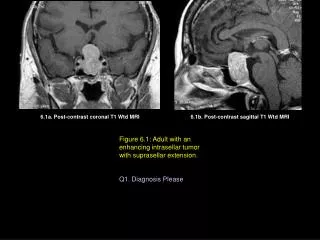
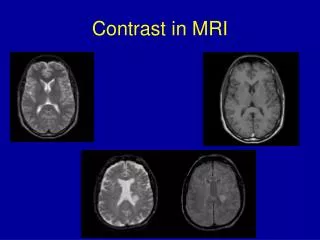
Contrast in MRI. Signal (measure of Mx, My). T 2 decay. TE. S= S o e -TE/T2. Perturbation of M o. When you perturb Mo, it will recover back to equilibrium with time constants T1 and T2. Signal (measure of Mz). TI. S = So (1-e -TI/T1 ). Dipole-dipole interaction.

E N D
Signal (measure of Mx, My) T2 decay TE S= So e -TE/T2 Perturbation of Mo • When you perturb Mo, it will recover back to equilibrium with time constants T1 and T2 Signal (measure of Mz) TI S = So (1-e-TI/T1)
Dipole-dipole interaction The dipole field around the proton at A alters the field experienced by the proton at B
Molecular relaxation mechanisms Protons Macromolecule Dipole coupling Spin exchange Proton exchange Molecular exchange Water
T1 measurement TI = 100, 250, 500, 1000, 1500, 2000, 3000, 5000 Signal from amplitude of FID TI S = So (1-2e ) -TI/T1
Vector coherence Schering
Fast spins (Dw +ve) x’ Mxy=0 Mxy at t=0 Slow spins (Dw -ve) Complete dephasing Time Dephasing
T2* artefacts Good(ish) shim Phantom with coin near it Bad shim
180o 90o T2 envelope FID T2* envelope fast f s slow Spin echo
Fate of multiphase meals Liver Meal liquid L R viscous Spleen Spinal cord 36 min 48 min 72 min Anatomical reference T = 90 mins Slow mixing of a porridge meal T= 14 mins Monitoring dilution
Signal Signal T1 weighting T2 weighting TI High contrast Low contrast TE High contrast Low contrast
Gd-DTPA molecule Structure of Ln(III)-DTPA complexes. Oxygen atoms are red, nitrogen atoms blue, carbon atoms grey and lanthanides green.