Lesson 6 (Interpreting Functional Relationships)
80 likes | 293 Views
How do you interpret functional relationships in a real-life problem?. Understand the problem (Summarize in your own words) Identify the quantities involved and any relationships between them Determine what the variables in the problem represent

Lesson 6 (Interpreting Functional Relationships)
E N D
Presentation Transcript
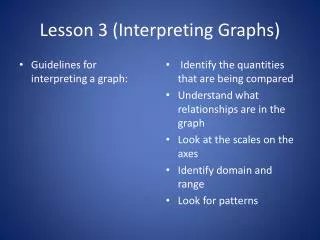
How do you interpret functional relationships in a real-life problem? Understand the problem (Summarize in your own words) Identify the quantities involved and any relationships between them Determine what the variables in the problem represent Determine what quantity each axis on the graph represents (What is the scale used on each axis?) Look for trends in the data (What are the maximum and minimum values in the graph?) Look for unusual data Match the data to the equations or formulas in the problem Lesson 6 (Interpreting Functional Relationships)
Example 1 Daisy wants to make a rectangular flower garden. She needs to put a fence around the garden so her dog will not dig in it. Daisy uses a total of 40 feet of fencing. She can choose different combinations of length and width for her garden. As the width of the rectangle increases, the area ________ until x=_____. Then the area begins to ________________. The function appears to achieve a maximum value at x=________. Using only _______ feet of fencing, a width of _____feet will give the greatest area for the garden. Lesson 6 (Interpreting Functional Relationships)
Example 2 The graph shows the daily high temperatures in degrees Fahrenheit over a two-week period in August. During which three-day period did the temperature decrease by the greatest number of degrees? The temperature decreased from August ___ to August ____ and then again from August ____ to August___. To determine which three period it decreased by the greatest number of degrees, you need to find the ________________ of these points and calculate the total drop in the daily high temperature. Lesson 6 (Interpreting Functional Relationships)
Example 2 Build a table to organize your work. The high temperature decreased by ____ oF from August ___ to August ____. This was the greatest _________ in temperature for any three-day period on the graph. Lesson 6 (Interpreting Functional Relationships)
What is the difference between Continuous and Discrete Functions? Continuous Functions: are represented by a graph in which there are no gaps, jumps, or holes Discrete Functions: are a function that takes on distinct values not connected by intermediate values. Lesson 6 (Interpreting Functional Relationships)
Lesson 6 (Interpreting Functional Relationships) • Continuous Function • Discrete Function
Example 3 The Bartlett Booster Club is purchasing baseball caps to sell at school. The graph shows the line C that models the cost of making the baseball caps in terms of the number of baseball caps and the line P that models profit in terms of the number of baseball caps. A line is represented as a dashed line if all points on the line would not represent the problem situation. Lesson 6 (Interpreting Functional Relationships)
Example 3 Write a function for the cost in terms of the number of baseball caps? Describe how to find the cost of 60 baseball caps. How many baseball caps were purchased if the cost was $340? Write the function for the profit in terms of the number of caps. Explain how to determine the profit from the sales of 200 caps. If the profit is the revenue minus the cost, what is an expression for the revenues? Describe how to determine the revenue from the sale of 54 caps. What does the function tell you about how they sold the baseball caps? Lesson 6 (Interpreting Functional Relationships)