Download
1 / 45
470 likes | 700 Views
Learn about quality costs, control objectives, and productivity measurement to enhance your business operations. Explore different dimensions of quality and the impact of quality changes on profitability.

E N D
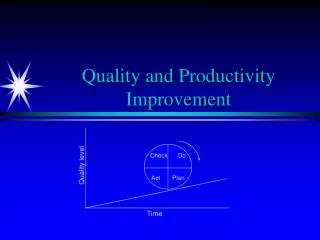
CHAPTER Quality Costs and Productivity: Measurement, Reporting, and Control
Objectives 1. Identify and describe the four types of quality costs. 2. Prepare a quality cost report and explain the difference between the conventional view of acceptable quality level and the view espoused by total quality control. 3. Tell why quality cost information is needed and how it is used. 4. Explain what productivity is, and calculate the impact of productive changes on profits. After studying this chapter, you should be able to:
Quality Defined A quality product or service is one that meets or exceeds customer expectations...
Quality Defined … on the following eight dimensions: • Performance • Aesthetics • Serviceability • Features • Reliability • Durability • Quality of conformance • Fitness for use
Quality Defined … on the following eight dimensions: How consistently and well a product functions • Performance • Aesthetics • Serviceability • Features • Reliability • Durability • Quality of conformance • Fitness for use The appearance of tangible products (style, beauty) Measures the ease of maintaining and/or repairing the product Characteristics of a product that differentiate functionally similar products The probability that the product or service will perform its intended function for a specified length of time
Quality Defined … on the following eight dimensions: The length of time a product functions • Performance • Aesthetics • Serviceability • Features • Reliability • Durability • Quality of conformance • Fitness for use A measure of how a product meets its specifications The suitability of the product for carrying out its advertised functions
Quality Defined A defective product is one that does not conform to specifications.
Quality Defined Zero defects means that all products conform to specifications.
Quality Defined The definition of quality-related activities imply four categories of quality costs: Incurred to prevent poor quality or services being produced Incurred to determine whether products and services conform to requirements • Preventive costs • Appraisal costs • Internal failure costs • External failure costs Incurred when products and services do not conform to specifications Incurred when products and services fail to conform to requirements after being delivered
Examples of Quality Costs Prevention costs Quality engineering Quality training programs Quality planning Quality reporting Supplier evaluation and selection Quality audits Quality circles Field trials Design reviews
Examples of Quality Costs Appraisal Costs Inspection of raw materials Testing of raw materials Packaging inspection Supervising appraisal Product acceptance Process acceptance Inspection of equipment Testing equipment Outside endorsements
Examples of Quality Costs Internal failure costs Scrap Rework Downtime (defect related) Reinspection Retesting Design changes
Examples of Quality Costs External failure costs Cost of recalls Lost sales Returns/allowances Warranties Repairs Product liability Customer dissatisfaction Lost market share Complaint adjustment
Measuring Quality Costs The Multiplier Method The Market Research Method Taguchi Quality Loss Function Hidden Quality Costs are opportunity costs resulting from poor quality.
The Multiplier Method The multiplier method assumes that the total failure cost is simply some multiple of measured failure costs: Total external failure cost = k(Measured external failure costs) where k is the multiplier effect If k = 4, and the measured external failure costs are $2 million, then the actual external failure costs are estimated to be $8 million.
The Market Research Method The market research method uses formal market research methods to assess the effect of poor quality on sales and market share. Customer surveys and interviews with members of a company’s sales force can provide significant insight into the magnitude of a company’s hidden costs. Market research results can be used to project future profit losses attributable to poor quality.
The Taguchi Quality Loss Function The Taguchi loss function assumes any variation from the target value of a quality characteristic causes hidden quality costs. Furthermore, the hidden quality costs increase quadratically as the actual value deviates from the target value.
The Taguchi Quality Loss Function Lower Specification Limit Upper Specification Limit $ Cost Target Value
The Taguchi Quality Loss Function L(y) = k(y – T)² k = A proportionately constant dependent upon the organization’s external failure cost structure y = Actual value of quality characteristic T = Target value of quality characteristic L = Quality loss
Quality Cost Report Unit Actual Diameter (y) y-T (y –T)² k(y-T)² 1 9.9 -0.10 0.010 $ 4.00 2 10.1 0.10 0.010 4.00 3 10.2 0.20 0.040 16.00 4 9.8 -0.20 0.040 16.00 Total 0.100 $40.00 Average 0.025 $10.00
Image Products Quality Cost Report For the Year Ended March 31, 2004 11-22 Quality Costs % of Sales Prevention costs: Quality training $35,000 Reliability engineering 80,000 $115,000 4.11 % Appraisal costs: Materials inspection $20,000 Product acceptance 10,000 Process acceptance 38,000 68,000 2.43 Internal failure costs: Scrap $50,000 Rework 35,000 85,000 3.04 External failure costs: Customer complaints $25,000 Warranty 25,000 Repair 15,000 65,000 2.32 Total quality costs $333,000 11.90 %
Relative Distribution of Quality Costs External Failure (19.5%) Prevention (34.5%) Internal Failure (25.6%) Appraisal (20.4%)
Quality Cost Graph AOL Total Quality Costs Cost Failure Costs Control Costs 0 100% Percent Defects
Contemporary Quality Cost Graph Cost Total Quality Costs Failure Costs Control Costs 100% 0 Percent Defects
Trend Analysis Assume the following data: Quality Costs Actual Sales % of Sales 2000 $440,000 $2,200,000 20.0% 2001 423,000 2,350,000 18.0 2002 412,500 2,750,000 15.0 2003 392,000 2,800,000 14.0 2004 280,000 2,800,000 10.0
Multiple-Period Trend Graph:Total Quality Costs % of Sales 20 15 10 5 0 1 2 3 4 5 Year
Multiple-Trend Analysis for Individual Quality Costs Assume the following quality cost data: Internal External Prevention Appraisal Failure Failure 2000 2.0%1 2.0% 6.0% 10.0 % 2001 3.0 2.4 4.0 8.6 2002 3.0 3.0 3.0 6.0 2003 4.0 3.0 2,5 4.5 2004 4.1 2.4 2.0 1.5 1Expressed as a % of sales
Multiple-Period Trend Graphic: Individual Quality Cost Categories Percentage of Sales 10 9 8 7 6 5 4 3 2 1 0 Prevention Appraisal Internal failure External failure 0 1 2 3 4 Year
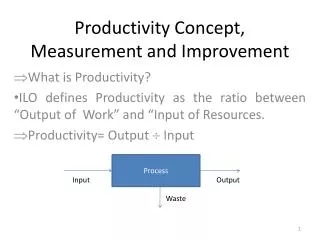
Productivity: Measurement and Control Productivity is concerned with producing output efficiently, and is it specifically addresses the relationship of output and the inputs used to produce the outputs.
Productivity: Measurement and Control Total productive efficiency is the point at which two conditions are satisfied: 1. for any mix of inputs that will produce a given output, no more of any one input is used than necessary to produce the output 2. given the mixes that satisfy the first condition, the least costly mix is chosen.
Technical Efficiency Inputs: Outputs: 4 Labor 6 Capital Technical Efficiency is the condition where no more of any one input is used than necessary to produce a given output. Technical efficiency improvementis when less inputs are used to produce the same output or more output are produced using the same input. Current productivity
Inputs: Outputs: 3 Labor 6 Capital Inputs: Outputs: 4 Labor 8 Capital Technical Efficiency Same Output, Fewer Inputs More Output, Same Inputs
Inputs: Outputs: 3 Labor 8 Capital Inputs: Outputs: 3 Labor 8 Capital $20,000,000 Technical Efficiency More Output, Fewer Inputs Technically Efficient Combination I:
Inputs: Outputs: 2 Labor 8 Capital $25,000,000 Technical Efficiency Technically Efficient Combination II: Of the two combinations that produce the same output, the least costly combination would be chosen.
Partial Productivity Measurement Partial Productivity Measurement: Measuring productivity for one input at a time. Partial Measure = Output/Input Operational Productivity Measure: Partial measure where both input and output are expressed in physical terms. Financial Productivity Measure: Partial measure where both input and output are expressed in dollars.
Profile measurement provides a series or a vector of separate and distinct partial operational measures.
Profile Productivity Measures Example 1: The productivity of both labor labor and materials moves in the same direction: 2003 2004 Number of motors produced 120,000 150,000 Labor hours used 40,000 37,500 Materials used (lbs.) 1,200,000 1,428,571 Partial Productivity Ratios 2003 Profile 2004 Profile Labor productivity ratio 3.000 4.000 Material productivity ratio 0.100 0.105 150,000/37,500 150,000/1,428,571
2003 2004 Number of motors produced 120,000 150,000 Labor hours used 40,000 37,500 Materials used (lbs.) 1,200,000 1,700,000 Partial Productivity Ratios 2003 Profile 2004 Profile Labor productivity ratio 3.000 4.000 Material productivity ratio 0.100 0.088 Profile Productivity Measures Example 2: Assume the same data as Example 1 except the material used is 1,700,000 pounds. 150,000/37,500 150,000/1,700,000
Profit-Linked Productivity Measurement Profit-Linkage Rule: For the current period, calculate the cost of the inputs that would have been used in the absence of any productivity change, and compare this cost with the cost of the inputs actually used. The difference in costs is the amount by which profits changed because of productivity changes. To compute the inputs that would have been used (PQ), use the following formula: • PQ = Current Output/Base-Period Productivity Ratio
Example: Kunkul provided the following data: 20032004 Number of motors produced 120,000 150,000 Labor hours used 40,000 37,500 Materials used (lbs.) 1,200,000 1,700,000 Unit selling price (motors) $50 $48 Wages per labor hour $11 $12 Cost per pound of material $2 $3 Profit-Linked Productivity Measurement
Cost of labor: (50,000 x $12) $ 600,000 Cost of materials: (1,500,000 x $3) 4,500,000 Total PQ cost $5,100,000 The actual cost of inputs: Cost of labor: (37,500 x $12) $ 450,000 Cost of materials: (1,700,000 x $3) 5,100,000 Total current cost $5,550,000 Profit-Linked Productivity Measurement PQ (labor) = 150,000/3 = 50,000 hrs. PQ (materials) = 150,000/0.100 = 1,500,000 lbs.
Profit-linked effect = Total PQ cost - Total current cost Profit-Linked Productivity Measurement = $5,100,000 – $5,550,000 = $450,000 decrease in profits The net effect of the process change was unfavorable. Profits declined $450,000 because of productivity changes.
Price-Recovery Component 2004 2003 Difference Revenues $7,200,000 $6,000,000 $ 1,200,000 Cost of inputs 5,550,000 2,840,000 2,710,000 Profit $1,650,000 $3,160,000 $-1,510,000 Price recovery = Profit change – Profit-linked productivity change The difference between the total profit change and the profit-linked productivity change is called theprice-recovery component. = $1,510,000 – $450,000 = $1,060,000
Chapter Eleven The End