Download
1 / 15
270 likes | 762 Views
Productivity Measurement and Improvement. Prepared by: Bhakti Joshi Date: November 29, 2012. Definition. Productivity is commonly defined as a ratio of a volume measure of output to a volume measure of input use OR Productivity = Output Input. Generated from production or service.

E N D
Productivity Measurement and Improvement Prepared by: Bhakti Joshi Date: November 29, 2012
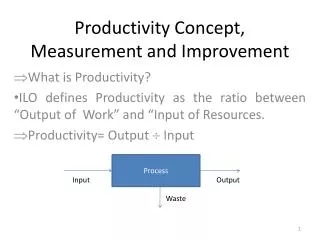
Definition Productivity is commonly defined as a ratio of a volume measure of output to a volume measure of input use OR Productivity = Output Input Generated from production or service Provided to create this output The concept of productivity can be applicable to any economy, business (small, medium and large), government and individuals
Numerical Example 1 OUTPUT Britannia Industries produces 30000 units of biscuits in October and the number of workers employed during this months was 30. These workers normally work 8 hours a day. Calculate the productivity for the month of October. • INPUT • Total Hours worked by workers = 30 workers * 8 hours = 240 • Total working days = 20 days. 4 weeks in a month * 5 working days. • 240*20 = 4800 30000/30 = 1000 units per labour 30000/4800 = 6.25 units per worker
Problem 1: Quarterly Productivity Data By what percentage has labour productivity improved or not improved?
Problem 1: Quarterly Productivity Data (Contd…) By what percentage has material productivity improved or not improved?
Quarterly Productivity Data (Contd…) • Determine the total productivity By what percentage has material productivity improved or not improved? • What about Profit?
Problem 2 A brewery produces 50,000 bottles of beer each week. The equipment costs are Rs 10000 and will remain productive for 3 years. The annual labour cost is Rs100000. Calculate the total productivity in units of output per rupee of input over a 3 year period
Problem 2 – Solution Suppose, the management has an option of Rs 20000 equipment with an operating life of 5 years that reduces labour cost to Rs 40000 per year. Should the management purchase this equipment (using productivity calculation methods)?
Problem 2 – Solution (Contd…) What does this mean?
Productivity Measurement - Types Partial Factor Productivity Labour Total Factor Productivity Capital Labour Capital Multi-Factor Productivity Capital Labour Energy Materials
Partial Factor Productivity • Traces labour requirement per unit or • Reflects change in input coefficient of labour PURPOSE • Ease in measurement and readable • Mostly easy to obtain relevant data ADVANTAGES • Partial productivity measure • Misinterpreted as technical change or efficiency/effectiveness of individuals in the labour force DISADVANTAGES
Total Factor Productivity • Traces growth in an economy or a business • Includes labour and especially capital that is representative of mostly infrastructure PURPOSE • Ease in obtaining data and to understand ADVANTAGES • Other inputs ignored • Net output does not reflect the efficiency of production system in a proper way • Not representative to technological change DISADVANTAGES
Multi-Factor Productivity • Overall changes in a firm/industry • Captures technical change, efficiency, economies of scale, etc PURPOSE • Role of intermediate inputs are also included • Measures technical change in an industry ADVANTAGES • Difficult to obtain data on all inputs • Inter-industry linkages and aggregation is difficult to communicate DISADVANTAGES
Email: bhaktij@gmail.comWebsite: www.headscratchingnotes.net