Download
1 / 22
220 likes | 256 Views
Explore the timeline of NHTSA's initiatives on light vehicle rollover safety, from early 1970s to present-day testing methodologies, focusing on dynamic maneuvers and metrics. Learn about key developments, challenges, and future directions.

E N D
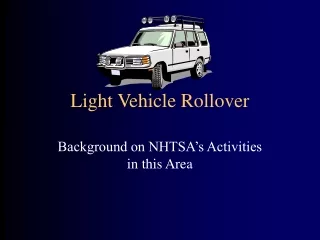
Light Vehicle Rollover Background on NHTSA’s Activities in this Area
Light Vehicle Tow-away Crashes 1995-1999 NASS-CDS3.4 million crashes per year Light Vehicle Occupant Fatalities 1999 FARS31,921 total occupants killed
Occupant Fatalities 1999 FARS LTVs Cars
Occupant Fatalities 1999 FARS SUVs Cars Vans Pickups
Chronology of NHTSA Rollover Actions - Page 1 • 1973: Advance Notice of Proposed Rulemaking on Minimum Standard for Rollover Resistance • 1978: Terminate action because of the difficulty in getting tip-up and lack of repeatability • 1986: Rep. Wirth petitions for minimum standard based on Static Stability Factor (SSF) • 1987: NHTSA denies Wirth petition because of difficulties measuring SSF and because SSF, while correlated to rollover risk if there is a crash, does not predict likelihood of crash • 1992: NHTSA issues ANPRM for minimum standard for rollover resistance based on vehicle metrics
The First NHTSA Rollover Rulemaking Action • 1973 ANPRM for safety standard “that would specify minimum performance requirements for rollover resistance” • Focus was on safety standard for the next 20 years • Goal is to set a level that eliminates unreasonable risk to safety • Challenge is to make it meaningful for cars and light trucks
The First NHTSA Rollover Rulemaking Action (Cont’d) • Agency’s early-70’s work was focused on rollovers on flat road surfaces, with hard driving maneuvers to induce rollover • After years of work, we concluded • Difficult to get wheel lift with even these maneuvers • Even more difficult to repeat wheel lift response • Could not use these maneuvers for standard
The Second NHTSA Rollover Rulemaking Action • NHTSA’s early work was with dynamic tests, but found too much variability • Mr. Wirth asked agency to use vehicle physical characteristics (SSF) as a surrogate measure of rollover propensity • From mid-80’s to mid-90’s, NHTSA analyzed different vehicle metrics as a potential means to address rollover • Three widely accepted metrics
Static Stability Factor (SSF)T/2hFirst order estimate of steady state lateral acceleration when rollover begins.
Critical Sliding Velocity (CSV)Theoretical lowest speed at which sliding sideways into a curb causes rollover. Vehicle Motion
Tilt Table Angle (TTA)Minimum table angle at which a vehicle on the table will tip over.
The Second NHTSA Rollover Rulemaking Action (Cont’d) • After evaluating a standard requiring a minimum SSF, NHTSA concluded: • Requested minimum would essentially make all vehicles cars - NOT NHTSA’s mission • SSF was too simple -correlated to rollover given a crash, but could not predict likelihood of being in a crash • Difficult to repeatably measure center-of-gravity height
The Third NHTSA Rollover Rulemaking Action • In 1992, NHTSA began a rulemaking with the goal of using a vehicle metric other than SSF to establish a minimum performance standard • Hoped this would: • Establish a base level of rollover resistance • Use greater ease and repeatability of metrics • Find a metric better than SSF
Chronology of NHTSA Rollover Actions - Page 2 • 1994: NHTSA terminates rulemaking on minimum standard, but proposes consumer information based on vehicle metric • 1994: Congress suspends rollover rulemaking until National Academy of Sciences (NAS) study of consumer information • 1996: NAS study published • 1996: NHTSA begins new study of feasibility of dynamic rollover • 1999: NHTSA publishes report of its testing results
Safety Standard vs. Consumer Information • In 1994, we terminated rulemaking on a vehicle standard - benefits were too low to justify costs of redesigning most light trucks • Because of the difficulties of the standard, NHTSA suggested providing consumer information, instead of a standard • This would give the public helpful information about what they are buying without restricting their ability to buy small SUVs and pickups
Recent NHTSA Testing of Dynamic Maneuvers • In 1997, NHTSA set out to see if it was now possible to develop a practicable, repeatable and appropriate emergency handling test • Chose best procedures from existing literature and selected some for further analysis • After analysis, did further testing with three maneuvers
J-Turn Maneuver brake pulse (if applicable) steering pulse hold steering & throttle accelerate to target test speed start
Resonant Steer Maneuver Step 1 Measure resonant steering frequency: Start: 0.2 Hz Start: 0.2 Hz End: 1.5 Hz End: 1.5 Hz increasing steering frequency Vehicle Path Vehicle Path Step 2 Drive test vehicle at resonant steering frequency: constant steering frequency Vehicle Path
Conclusions on Dynamic Testing vs Metrics • These dynamic tests give reasonable results that correspond to real-world performance • But dynamic tests are not better than metrics at predicting rollover involvement. • Extra expense of dynamic testing is substantial. • Several practical problems remain with vehicle testing: • Use of human driver leads to safety concerns and mandates use of outriggers. • Outriggers affect handling. • Tire debeading may mask true limit behavior
Why Choose SSF as the Metric for Consumer Information? • None of the three metrics was the clear winner statistically. • SSF is the only metric that will do no harm. • SSF has broad industry acceptance as “first order” design consideration. • SSF is least complex, intuitively related to rollover.
Rollover Actions in the Past 12 Months • June 2000: NHTSA proposes rollover consumer information using SSF • October 2000: Congress mandates NAS study of NHTSA’s proposed SSF rollover information program • November 2000: Congress requires NHTSA to provide consumer information on performance in dynamic rollover testing as of November 2002 • January 2001: NHTSA issues first rollover ratings based on SSF