Download
1 / 50
520 likes | 765 Views
EBI web resources I: databases and tools. Yanbin Yin Fall 2014. Outline. Intro to EBI Databases and web tools UniProt Gene Ontology Hands on Practice. MOST MATERIALS ARE FROM: http ://www.ebi.ac.uk/training/online/course- list. Three international nucleotide sequence databases.

E N D
EBI web resources I: databases and tools Yanbin Yin Fall 2014
Outline • Intro to EBI • Databases and web tools • UniProt • Gene Ontology • Hands on Practice MOST MATERIALS ARE FROM: http://www.ebi.ac.uk/training/online/course-list
The European Bioinformatics Institute (EBI) Created in 1992 as part of European Molecular Biology Laboratory (EMBL) EMBL was created in 1974 and is amolecular biology research institution supported by 20 European countries and Australia Wellcome Trust Genome Campus, Hinxton,Cambridge, UK Neighbor of Wellcome Trust Sanger Institute
Research groups in EBI InterPro miRBase UniProt
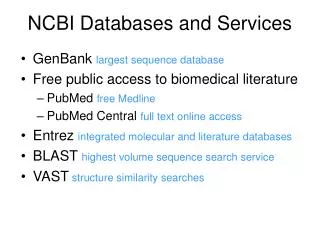
Major databases in EBI EMBL-Bank (DNA and RNA sequences) Ensembl (genomes) ArrayExpress(microarray-based gene-expression data) UniProt (protein sequences) InterPro(protein families, domains and motifs) PDBe (macromolecular structures) Others, such as IntAct (protein–protein interactions) Reactome (pathways) ChEBI (small molecules) IntEnz (enzyme classification) GO (gene ontology) GenBank Genome MapView GEO GenPept (nr) CDD MMDB Swiss Institute of Bioinformatics Sanger Institute
http://www.ebi.ac.uk/training/online/course/nucleotide-sequence-data-resources-ebihttp://www.ebi.ac.uk/training/online/course/nucleotide-sequence-data-resources-ebi chromatograms
Sequence might first enter ENA as SRA (Sequence Read Archive) fragmented sequence reads; it might be re-submitted as assembled WGS (Whole Genome Shotgun) sequence overlap contigs; it might be re-submitted again with further assembly as CON (Constructed) sequence entries, with the older WGS entries being consigned to the Sequence Version Archive
Data is first split into classes, then it is split into intersecting slices by taxonomy
Curation generation http://cys.bios.niu.edu/yyin/teach/PBB/Bioinformatics%20Curation%20generation.pdf Life as a Scientific Curator http://www.ebi.ac.uk/about/jobs/career-profiles/scientific-curator Scientific Database Curator job : Cambridge, United Kingdom http://www.nature.com/naturejobs/science/jobs/444213-scientific-database-curator
www.uniprot.org http://www.uniprot.org/help/about http://www.uniprot.org/docs/uniprot_flyer.pdf
http://cys.bios.niu.edu/yyin/teach/PBB/at-id.txt Choose TAIR here and UniProtKB here
Select the PAL proteins and align them Clustal omega program will be called to alignment the selected protein seqs May take 1 min to finish
This is the MSA result page Toggle these options on will add colors in the alignment
Go back to the protein list page Selecting one protein will enable the BLAST button Choose advanced will allow to change BLAST parameters
We are going to search UniProt proteomes for human protein set Click on Advanced you will see a pop-out window Here you can specify search terms
Click here to get help Click here to open a new page
Gene Ontology http://geneontology.org/page/documentation The Gene Ontology (GO) project is a collaborative effort to address the need for consistent descriptions of gene products in different databases The project began as a collaboration between three model organism databases, FlyBase (Drosophila), the Saccharomyces Genome Database (SGD) and the Mouse Genome Database (MGD), in 1998 Three structured controlled vocabularies (ontologies) that describe gene products in terms of their associated biological processes, cellular components and molecular functions in a species-independent manner. There are three separate aspects to this effort: 1, the development and maintenance of the ontologies themselves; 2, the annotation of gene products, which entails making associations between the ontologies and the genes and gene products in the collaborating databases; and 3, development of tools that facilitate the creation, maintenance and use of ontologies.
The scope of GO Gene Ontology covers three domains: cellular component, the parts of a cell or its extracellular environment; molecular function, the elemental activities of a gene product at the molecular level, such as binding or catalysis; biological process, operations or sets of molecular events with a defined beginning and end, pertinent to the functioning of integrated living units: cells, tissues, organs, and organisms GO is not a database of gene sequences, nor a catalog of gene products. Rather, GO describes how gene products behave in a cellular context. GO is not a dictated standard, mandating nomenclature across databases. Groups participate because of self-interest, and cooperate to arrive at a consensus. GO is not a way to unify biological databases (i.e. GO is not a 'federated solution'). Sharing vocabulary is a step towards unification, but is not, in itself, sufficient.
The structure of GO can be described in terms of a graph, where each GO term is a node, and the relationships between the terms are edges between the nodes. GO is loosely hierarchical, with 'child' terms being more specialized than their 'parent' terms, but unlike a strict hierarchy, a term may have more than one parent term http://geneontology.org/page/ontology-structure
id: GO:0000016 name: lactase activity namespace: molecular_function def: "Catalysis of the reaction: lactose + H2O = D-glucose + D-galactose." [EC:3.2.1.108] synonym: "lactase-phlorizin hydrolase activity" BROAD [EC:3.2.1.108] synonym: "lactose galactohydrolase activity" EXACT [EC:3.2.1.108] xref: EC:3.2.1.108 xref: MetaCyc:LACTASE-RXN xref: Reactome:20536 is_a: GO:0004553 ! hydrolase activity, hydrolyzing O-glycosyl compounds http://www.ebi.ac.uk/training/online/course/go-quick-tour/what-can-i-do-go
Enrichment analysis: use statistical test e.g. Fisher exact test Example: in human genome background (20,000 gene total), 40 genes are involved in p53 signaling pathway. A given gene list has found that 3 out of 300 belong to p53 signaling pathway. Then we ask the question if 3/300 is more than random chance comparing to the human background of 40/20000 http://david.abcc.ncifcrf.gov/helps/functional_annotation.html#E4
UniProt-GO annotation (GOA) http://www.ebi.ac.uk/training/online/course/uniprot-goa-quick-tour/what-uniprot-goa
UniProt-GOA format The reference used to make the annotation (e.g. a journal article) An evidence code denoting the type of evidence upon which the annotation is based The date and the creator of the annotation Gene product: Actin, alpha cardiac muscle 1, UniProtKB:P68032 GO term: heart contraction ; GO:0060047 (biological process) Evidence code: Inferred from Mutant Phenotype (IMP) Reference: PMID 17611253 Assigned by: UniProtKB, June 6, 2008
The idea of GO annotation for new sequences • If you have a new genome/transcriptome sequenced, how do you • perform a GO annotation for it? • Find a closet model organism which has been annotated by GO • BLAST your data against this closest organism • Transfer the GO annotation of the best match to your query sequences • For instance, if we want to annotate fern transcriptome with GO function descriptions …. • Find Arabidopsis UniProt protein dataset • Find the Arabidopsis GOA association file • BLASTx fern reads (or assembled UniGenes) against the UniProt set • Analyze BLAST result to link fern reads GO terms
http://amigo1.geneontology.org/cgi-bin/amigo/blast.cgi Get an example protein sequence file from http://cys.bios.niu.edu/yyin/teach/PBB/csl-pr.fa
This is easy. Now let’s try to get a list of differentially expressed genes and then find what’s common in this list of genes in terms of functions. We’re gonna use NCBI GEO website to get the gene list and then feed the gene list to GO enrichment analysis tools
Go to NCBI home page, search GEO DataSets with keyword “liver cancer”, and hit search
Top hits are always GEO DataSets, let’s choose the 3rd one, hit Analyze DataSet
Choose “Compare 2 sets of samples” Choose “Value means difference” Choose “8+ fold” Choose “higher” Then go to Step 2 Select to choose group A: three samples for COP 1 depletion and Huh7 cell line Group B: three samples for negative control and Huh7 cell line Hit ok, and go to Step 3
Total 398 gene profiles are found with 8+ fold higher expression in COP 1 depletion than in negative control in Huh7 cell line To get the list of genes, choose Gene database and hit Find items
Total 354 genes correspond to 398 gene profiles To download the list of Gene IDs, hit Send to, choose UI list as format and hit Create file A file named “gene_result.txt” will be automatically downloaded to your local computer Find out where it is downloaded to, open it using notepad++
View the file using notepad++ Next we will use DAVID to perform function enrichment analysis
The Database for Annotation, Visualization andIntegratedDiscovery (DAVID ) Hit start analysis
Upload the list of Gene IDs Select ENTREZ_GENE_ID Click on Gene list
This allows you to view functional annotation from various resources including GO Check the submitted gene list
This classifies the input genes into groups according to their functional relatedness
If you have clicked on Functional Annotation tool, you are at this page All these can be changed by users (to show not to show and show what) Click here will open a new window to show the clusters of functional annotations (terms)
These are clusters of functional terms, not genes (remember redundancy created by different databases?)