Download
1 / 24
550 likes | 1.46k Views
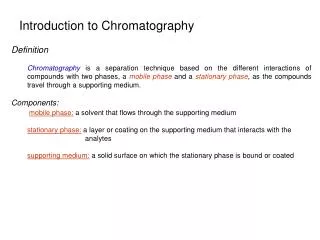
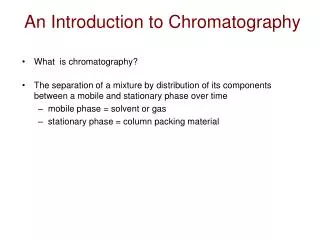
Introduction to Chromatography. Definition Chromatography is a separation technique based on the different interactions of compounds with two phases, a mobile phase and a stationary phase , as the compounds travel through a supporting medium. Components:

E N D
Introduction to Chromatography Definition Chromatography is a separation technique based on the different interactions of compounds with two phases, a mobile phase and a stationary phase, as the compounds travel through a supporting medium. Components: mobile phase:a solvent that flows through the supporting medium stationary phase: a layer or coating on the supporting medium that interacts with the analytes supporting medium: a solid surface on which the stationary phase is bound or coated
The analytes interacting most strongly with the stationary phase will take longer to pass through the system than those with weaker interactions. These interactions are usually chemical in nature, but in some cases physical interactions can also be used.
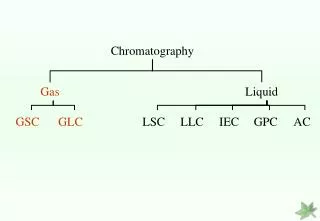
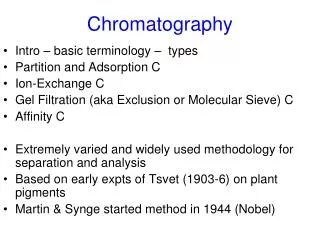
Types of Chromatography 1.) The primary division of chromatographic techniques is based on the type of mobile phase used in the system: Type of ChromatographyType of Mobile Phase Gas chromatography (GC) gas Liquid chromatograph (LC) liquid 2.) Further divisions can be made based on the type of stationary phase used in the system: Gas Chromatography Name of GC MethodType of Stationary Phase Gas-solid chromatography solid, underivatized support Gas-liquid chromatography liquid-coated support Bonded-phase gas chromatography chemically-derivatized support
Types of Chromatography Liquid Chromatography Name of LC MethodType of Stationary Phase Adsorption chromatography solid, underivatized support Partition chromatography liquid-coated or derivatized support Ion-exchange chromatography support containing fixed charges Size exclusion chromatography porous support Affinity chromatography support with immobilized ligand
3.) Chromatographic techniques may also be classified based on the type of support material used in the system: Packed bed (column) chromatography Open tubular (capillary) chromatography Open bed (planar) chromatography
Theory of Chromatography 1.) Typical response obtained by chromatography (i.e., a chromatogram): chromatogram - concentration versus elution time Wh Wb Inject Where: tR = retention time tM= void time Wb = baseline width of the peak in time units Wh = half-height width of the peak in time units
Note: The separation of solutes in chromatography depends on two factors: (a) a difference in the retention of solutes (i.e., a difference in their time or volume of elution (b) a sufficiently narrow width of the solute peaks (i.e, good efficiency for the separation system) A similar plot can be made in terms of elution volume instead of elution time. If volumes are used, the volume of the mobile phase that it takes to elute a peak off of the column is referred to as the retention volume (VR) and the amount of mobile phase that it takes to elute a non-retained component is referred to as the void volume (VM). Peak width & peak position determine separation of peaks
2.) Solute Retention: A solute’s retention time or retention volume in chromatography is directly related to the strength of the solute’s interaction with the mobile and stationary phases. Retention on a given column pertain to the particulars of that system: - size of the column - flow rate of the mobile phase Capacity factor (k’): more universal measure of retention, determined from tR or VR. k’ = (tR –tM)/tM or k’ = (VR –VM)/VM capacity factor is useful for comparing results obtained on different systems since it is independent on column length and flow-rate.
moles Astationary phase k’ = moles Amobile phase The value of the capacity factor is useful in understanding the retention mechanisms for a solute, since the fundamental definition of k’ is: k’ is directly related to the strength of the interaction between a solute with the stationary and mobile phases. Moles Astationary phase and moles Amobile phase represents the amount of solute present in each phase at equilibrium. Equilibrium is achieved or approached at the center of a chromatographic peak. When k' is # 1.0, separation is poor When k' is > 30, separation is slow When k' is = 2-10, separation is optimum
A simple example relating k’ to the interactions of a solute in a column is illustrated for partition chromatography: KD » A (mobile phase) A (stationary phase) where: KD = equilibrium constant for the distribution of A between the mobile phase and stationary phase Assuming local equilibrium at the center of the chromatographic peak: [A]stationary phase Volumestationary phase k’ = [A]mobile phase Volumemobilephase Volumestationary phase k’ = KD Volumemobilephase As KD increases, interaction of the solute with the stationary phase becomes more favorable and the solute’s retention (k’) increases
Volumestationary phase k’ = KD Volumemobilephase Separation between two solutes requires different KD’s for their interactions with the mobile and stationary phases since peak separation also represents different changes in free energy DG = -RT ln KD
3.) Efficiency: Efficiency is related experimentally to a solute’s peak width. - an efficient system will produce narrow peaks - narrow peaks smaller difference in interactions in order to separate two solutes Efficiency is related theoretically to the various kinetic processes that are involved in solute retention and transport in the column - determine the width or standard deviation (s) of peaks Estimate s from peak widths, assuming Gaussian shaped peak: Wb = 4s Wh = 2.354s Wh Dependent on the amount of time that a solute spends in the column (k’ or tR)
Number of theoretical plates (N): compare efficiencies of a system for solutes that have different retention times N = (tR/s)2 or for a Gaussian shaped peak N = 16 (tR/Wb)2 N = 5.54 (tR/Wh)2 The larger the value of N is for a column, the better the column will be able to separate two compounds. - the better the ability to resolve solutes that have small differences in retention - N is independent of solute retention - N is dependent on the length of the column
Plate height or height equivalent of a theoretical plate (H or HETP): compare efficiencies of columns with different lengths: H = L/N where: L = column length N = number of theoretical plates for the column Note: H simply gives the length of the column that corresponds to one theoretical plate H can be also used to relate various chromatographic parameters (e.g., flow rate, particle size, etc.) to the kinetic processes that give rise to peak broadening: Why Do Bands Spread? a. Eddy diffusion b. Mobile phase mass transfer c. Stagnant mobile phase mass transfer d. Stationary phase mass transfer e. Longitudinal diffusion
a.) Eddy diffusion– a process that leads to peak (band) broadening due to the presence of multiple flow paths through a packed column. As solute molecules travel through the column, some arrive at the end sooner then others simply due to the different path traveled around the support particles in the column that result in different travel distances. Longer path arrives at end of column after (1).
b.) Mobile phase mass transfer– a process of peak broadening caused by the presence of different flow profile within channels or between particles of the support in the column. A solute in the center of the channel moves more quickly than solute at the edges, it will tend to reach the end of the channel first leading to band-broadening The degree of band-broadening due to eddy diffusion and mobile phase mass transfer depends mainly on: 1) the size of the packing material 2) the diffusion rate of the solute
c.) Stagnant mobile phase mass transfer– band-broadening due to differences in the rate of diffusion of the solute molecules between the mobile phase outside the pores of the support (flowing mobile phase) to the mobile phase within the pores of the support (stagnant mobile phase). Since a solute does not travel down the column when it is in the stagnant mobile phase, it spends a longer time in the column than solute that remains in the flowing mobile phase. The degree of band-broadening due to stagnant mobile phase mass transfer depends on: 1) the size, shape and pore structure of the packing material 2) the diffusion and retention of the solute 3) the flow-rate of the solute through the column
d.) Stationary phase mass transfer– band-broadening due to the movement of solute between the stagnant phase and the stationary phase. Since different solute molecules spend different lengths of time in the stationary phase, they also spend different amounts of time on the column, giving rise to band-broadening. The degree of band-broadening due to stationary phase mass transfer depends on: 1) the retention and diffusion of the solute 2) the flow-rate of the solute through the column 3) the kinetics of interaction between the solute and the stationary phase
e.) Longitudinal diffusion– band-broadening due to the diffusion of the solute along the length of the column in the flowing mobile phase. The degree of band-broadening due to longitudinal diffusion depends on: 1) the diffusion of the solute 2) the flow-rate of the solute through the column
Van Deemter equation: relates flow-rate or linear velocity to H: H = A + B/m + Cm where: m = linear velocity (flow-rate x Vm/L) H = total plate height of the column A = constant representing eddy diffusion & mobile phase mass transfer B = constant representing longitudinal diffusion C = constant representing stagnant mobile phase & stationary phase mass transfer One use of plate height (H) is to relate these kinetic process to band broadening to a parameter of the chromatographic system (e.g., flow-rate). This relationship is used to predict what the resulting effect would be of varying this parameter on the overall efficiency of the chromatographic system. Number of theoretical plates(N)(N) = 5.54 (tR/Wh)2peak width (Wh) H = L/N
Plot of van Deemter equation shows how H changes with the linear velocity (flow-rate) of the mobile phase m optimum Optimum linear velocity (mopt) - where H has a minimum value and the point of maximum column efficiency: mopt is easy to achieve for gas chromatography, but is usually too small for liquid chromatography requiring flow-rates higher than optimal to separate compounds
4.) Measures of Solute Separation: separation factor(a) – parameter used to describe how well two solutes are separated by a chromatographic system: a = k’2/k’1 k’ = (tR –tM)/tM where: k’1 = the capacity factor of the first solute k’2 = the capacity factor of the second solute, with k’2³k’1 A value of a$1.1 is usually indicative of a good separation Does not consider the effect of column efficiency or peak widths, only retention.
resolution(RS) – resolution between two peaks is a second measure of how well two peaks are separated: where: tr1, Wb1 = retention time and baseline width for the first eluting peak tr2, Wb2 = retention time and baseline width for the second eluting peak Rs is preferred over a since both retention (tr) and column efficiency (Wb) are considered in defining peak separation. Rs$1.5 represents baseline resolution, or complete separation of two neighboring solutes ideal case. Rs$ 1.0 considered adequate for most separations.
Example 12: Given the following data and a 24.7 cm column calculate the resolution between species C and D. What column length is required for a resolution of 1.5?