
Populations: Growth, Factors & Impacts
E N D
Presentation Transcript
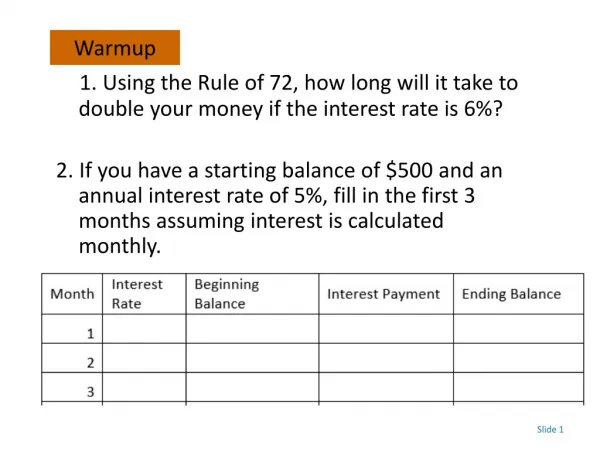
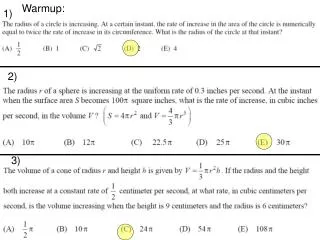
Warmup Which alternative energy source do you think is best? Why? List nonrenewable resources.
Populations 2.8.3a Explain carrying capacity. 2.8.3b Infer limiting factors to human population growth. 2.8.3c Summarize the impacts of a growing population on the natural resources in North Carolina.
Populations • Remember, a population is a group of one species of organism living in a specific place. • Three important characteristics of populations are: • geographic distribution—range, the area inhabited by a population • population density—number of individuals per unit area • growth rate—change in size of the population
Populations • Three factors affect population size: • number of births • number of deaths • number of individuals that enter or leave the population • Immigration is the movement of individuals Into a population • Emigration is the movement of individuals out of a population (Exiting).
Population Graphs Exponential Growth Logistic Growth
Exponential Population Growth If a population has unlimited resources, it will grow exponentially. The graph of exponential growth looks like the graph on the left. At first the numbers of individuals increase slowly, but over time the population becomes larger and larger to form a J-shaped curve.
Limits to Growth Populations do not grow to infinity because there are things in the environment that limit how much they can grow. These are called limiting factors—something that causes population growth to decrease. There are two types of limiting factors:
Limits to Growth Examples of density-dependent limiting factors—competition, predation, parasitism, and disease. These affect larger, dense populations more than smaller ones.
Limits to Growth Examples of density-independent limiting factors—weather, natural disasters, seasonal cycles, and human activities. These affect any population, large or small.
Logistic Population Growth In the real world, resources are almost always limited, so exponential growth does not occur very often in nature. As resources become less available, the growth of a population slows or stops. This is called logistic growth. The place where the graph evens out to a straight line shows where the population growth levels off. This is the carrying capacity, which is the number of individuals that an environment can support.
Human Population Growth For most of human existence, the human population grew very slowly because life was harsh and limiting factors kept population sizes low—food was scarce, diseases were wide-spread, only ½ the children in the world survived to adulthood.
Human Population Growth • About 500 years ago, the human population started growing much more rapidly because: • agriculture and industry made food easier to come by and easier to keep without spoiling • needed goods could be easily shipped around the world • improved sanitation and medicine reduced the death rate, increased the birth rate, and allowed people to live longer
Human Population Growth What type of growth curve does the human population show: exponential or logistic?
Human Population Growth Demography is the study of human populations. Scientists use demography to study how birth rates, death rates, and the age structure of populations help predict why some countries have high growth rates while others have lower growth rates. As societies modernize, they increase their level of education and raise their standards of living, and this leads to families having fewer children. Because the birthrate falls, population growth slows. If the birthrate matches the death rate, population growth will stop because the population will remain the same size.
Human Population Growth Demographers use age-structure diagrams to graph the numbers of people in different age groups in a population.
Human Population Growth In Nigeria there are a large number of babies and people having babies, and not many people live to be very old. This causes the population to grow rapidly. In the United States, there are fewer babies than there are people in their 30s and 40s. This causes a slower growth in population. In older industrialized countries, like Germany, the number of births and the number of deaths are about equal, which causes zero population growth since 1 person is born for every 1 person that dies.
Some questions to think about… Will the human population continue to grow at its current rate, or will it level out to a logistic growth curve? What damages can occur to the Earth if human population growth doesn’t slow down or stop?
Predator-Prey Populations in nature are often controlled by predation. Remember a predator is an animal that hunts and kills its food, the animal that is hunted and killed is called the prey.
Predator-Prey The interactions between predator populations and prey populations can be seen easily on a graph: The predator population and the prey population follow each other, because each one depends on the other.
Predator-Prey As the predator’s numbers increase, they require more food. As more prey get eaten, their population will decrease. With less food available, more predators will go hungry and their population will decrease. As fewer predators are eating the prey, the prey population will increase. With more food available, the predator population will increase, and this starts the cycle over again.