Download
1 / 47
470 likes | 491 Views
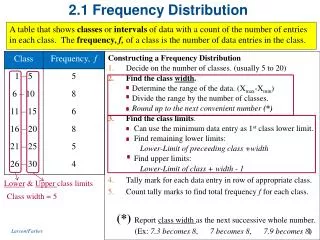
Pattern Measurement. Stochastic Frequency Distribution Analysis Created by Roy R. Rosenberger, Verity IA LLC royr@verityia.com. Patterns are pervasive!. Formation Transmitted Light. Calender Blackening. IGT Strips. Formation X-ray. Prufbau Strips.

E N D
Pattern Measurement Stochastic Frequency Distribution Analysis Created by Roy R. Rosenberger, Verity IA LLC royr@verityia.com Verity IA - Stochastic Frequency Distribution Analysis
Patterns are pervasive! Formation Transmitted Light Calender Blackening IGT Strips Formation X-ray Prufbau Strips The Stochastic Frequency Distribution Analysis measurement algorithm has been applied to: Verity IA - Stochastic Frequency Distribution Analysis
Measurement Apparatus Verity IA Pattern analysis software White faced specimen weight Scanner with axially symmetric illumination Scanner transmission tray with glass specimen weight overlay Fast computer with 512 RAM Scanners with axially symmetric illumination have proven to be the best for acquiring the large RGB digital images necessary to measure spatially distributed mottle. Verity IA - Stochastic Frequency Distribution Analysis
Pattern Measurement The underlying algorithm for all applications is the stochastic Frequency Distribution Analysis (SFDA) developed by Verity IA. It is employed with different operation constants for the wide variety of patterns to which it is applied. What is Stochastic Analysis? Verity IA - Stochastic Frequency Distribution Analysis
Stochas Stochastic: Derives from the Greek, stochas, for target. Imagine a target shoot with nine (9) marksmen. 10-8-6-4-2-0-2-4-6-8-10 Each marksman has the same number of shots: nine (9). In this match, the marksman’s skill is determined by the Standard Deviation ( sor Error) of the distance the marksman’s nine shots are from the center of the target. Verity IA - Stochastic Frequency Distribution Analysis
Each target score , s1 to n , is used to calculate the Standard Deviation , SDs, and the Mean, Xs, ( or team score) for the group of targets. Statistically, the marksman’s skill is determined by the Standard Deviation (sor Error) of the distance the marksman’s nine shots are from the center of the target. Thesor Error for each target arranged as a 2D data array: 4, 6, 5 8, 4, 2 3, 3, 3 Verity IA - Stochastic Frequency Distribution Analysis
145 120 170 180 100 145 145 170 175 In a digital image the target has 256 imaginary rings determined by the 8 bit luminance value for each picture point, where Black = 0 & White = 255. As each arrow hits this target it strikes one of 256 rings and the score is recorded as a luminance value. Verity IA - Stochastic Frequency Distribution Analysis
Stochastic Distribution 1 - The square target area is moved across the image in a regular pattern of rows and columns to form a uniform 2D matrix. 2 - The Differences among the picture point luminance values (LV) within each target is calculated and saved in a 2 D vector. 3 - The Std. Dev. and Average of the target Differences are two of the three terms used compute the Pattern Measurement Number. Formation Magnified 15 x Verity IA - Stochastic Frequency Distribution Analysis
Stochastic Distribution The Area of Interest is covered with contiguous targets Statistical data from each target are saved in a 2D array for subsequent computation of overall Pattern Number. Directional orientation The 2d array can also used to extract the horizontal (CD) and vertical (MD) variations Formation Magnified 15 x Verity IA - Stochastic Frequency Distribution Analysis
Applying Stochastic Frequency Distribution Analysis to Pattern Measurement Verity IA - Stochastic Frequency Distribution Analysis
A B C Which image has the most distinctive pattern? A, B & C have exactly the same number of each target luminance values (LV), but they are distributed differently within the inspection area. ISO 13660 Mottle (A) = ISO 13660 Mottle (B) = ISO 13660 Mottle (C) ISO 13660 provides the same number for each pattern. Verity IA - Stochastic Frequency Distribution Analysis
220 150 Y Pixels 100 20 X Pixels Verity IA SFDA based Pattern Measurement works on a digital image of any size and recognizes each pixel as a separate measurement unit. Luminance Value (LV) is the digital value of the measurement element on a scale of 0 to 255 Tile, always 2 x 2 Verity IA - Stochastic Frequency Distribution Analysis
1 2 3 Compute: Gray Scale Luminance Value (LV) for each area in the 2 x 2 tile A = 220 B = 20 A = 220 B = 20 A = 160 B = 120 { *Abs (A – B) + Abs (A – C) + Abs (A – D) + Abs (B – C) + Abs (B – D) + Abs (C – D) } Diff = C = 120 D = 160 C = 120 D = 20 C = 20 D = 220 Compute: Absolute Difference Among the area LV’s * Absolute difference What characteristic differentiates these images? The transition in shade within a 2 x 2 target Each image has the same number of areas with the same LV. Count = 144 AD = The Absolute Pixel LV Difference, is proportional to the rate of change or transition from light to dark among the four (4) LV. 1 Diff = 640 2 Diff = 640 3 Diff = 700 Verity IA - Stochastic Frequency Distribution Analysis
Absolute Pixel LV Difference (AD) & Average Pixel LV (M) Use image #3 as example AD1 to 36 & M1 to 36 Create two Data Files ¼ the size of source AD AD AD AD AD AD AD AD AD AD AD AD AD AD AD AD AD AD AD AD AD AD AD AD AD AD AD AD AD AD AD AD AD AD AD AD Populate with results from each tile Pattern Measurement Calculate two properties of the 2 x 2 target Each image has the same number of areas with the same LV. Count = 144 Verity IA - Stochastic Frequency Distribution Analysis
Standard Deviation among the Differences: sAD Average Difference: AveAD Standard Deviation among the Averages: sM) AD1 to 36 & M1 to 36 Layer X =AveAD XsAD X sM AD AD AD AD AD AD AD AD AD AD AD AD AD AD AD AD AD AD AD AD AD AD AD AD AD AD AD AD AD AD AD AD AD AD AD AD Pattern Measurement – Basic Premise 2 (A Measure of transitions) (Similar to ISO 13660 Mottle) Populate data files with results from each tile Where: AD = Absolute Difference among LV M = Average of LV Verity IA - Stochastic Frequency Distribution Analysis
Transitions within the Image: The absolute difference in the luminance values among the four (4) picture elements within a 2 element x 2 element target is an index of the three dimensional rate of change. The standard deviation of these indices and their average are two terms in the Pattern Number calculation. Spatial Luminance Variance (LV): The average LV for these same four (4) picture elements is used to create a new element stored in a new data base ¼ the size of the original image. The standard deviation among these new elements is the spatial distribution component in the Pattern Number calculation. Verity IA - Stochastic Frequency Distribution Analysis
Building the Target Size Layer The four (4) elements within the tile are averaged together. These averages are then used to create a new virtual image or layer dedicated to the target size. Each target in the new layer is twice the physical width & height of the original but remains 2 elements x 2 elements. Verity IA - Stochastic Frequency Distribution Analysis
Based upon a digital image of any size, the method recognizes each pixel as a separate sensor. Each Target is 2 Elements x 2 Elements based on the average of the previous layer 2 Element x 2 Element tile. Four target of this size will not fit in the image. The spatial measurement will be limited to the first four. Y Pixels X Pixels Spatial Distribution – Tile Physical Size – Limited by Image The target physical dimensions in each layer follow a binary progression. When overlaid on the original pixel image the tile sizes progress from: 2 pixels x 2 pixels in layer 1 to 1024 pixels by 1024 pixels in layer 10. The actual tile dimensions are resolved based upon the sensor calibration or camera resolution, ppi, ppi. Verity IA - Stochastic Frequency Distribution Analysis
Spatial Perception – Spatial Distribution 3 – Data Source Layers Layer 2 Original Pixel Image Layer 1 Averaging the four data cells in the previous layer to create the new layer data cell suppresses the higher frequency variations present in the previous layer. No more layers can be formed from this small image. Larger targets will not fit. Verity IA - Stochastic Frequency Distribution Analysis
The tile averages become the basis of the next layer (x+1) mottle measurement Spatial Mottle Analysis Layer X - 1 (Original Scale) Spatial Mottle Analysis Layer X + 1 (Original Scale) Spatial Mottle Analysis Layer X (Original Scale) AD1 to 6 & M1 to 6 AD1 to 36 & M1 to 36 To Max of 10 Target Sizes x = Mottle# TileX+1 AD AD AD AD AD AD AD AD AD AD AD AD AD AD AD AD AD AD AD AD AD AD AD AD AD AD AD AD AD AD AD AD AD AD AD AD AD AD AD AD AD AD AD AD AD AveADx sAD sM AveAD x sAD x sM = Mottle# Tile Size X Building the Layers - Spatial Distribution Verity IA - Stochastic Frequency Distribution Analysis
Layer 0 = Individual pixels of any size, resolution, or calibration Layer 1 = Pixels grouped, 2 x 2 (2 pixels x 2 pixels) Layers 6, 7, 8, 9, & 10 each grouped 2 x 2 to a maximum of 1024 pixels x 1024 pixels in the underlying image Layer 4 = Layer 3 Ave. grouped, 2 x 2 (16p x 16p) Layer 2 = Layer 1 Averages grouped, 2 x 2 (4 p x 4 p) Layer 3 = Layer 2 Averagesgrouped, 2 x 2 (8p x 8p) To maximum of 10 layers with minimum of four (4) grouped data per layer. The last layer is the one that will allow a minimum of four (4) data cells to be created. Layer 5 = Layer 4 Ave.grouped, 2 x 2 (32p x 32p) Spatial Distribution – Each Layer Dedicated to a Target Size The target physical dimensions in each layer follow a binary progression. When overlaid on the original pixel image the tile sizes progress from: 2 pixels x 2 pixels in layer 1 to 1024 pixels by 1024 pixels in layer 10. The actual tile dimensions are resolved based upon the sensor calibration or camera resolution, ppi, ppi. Verity IA - Stochastic Frequency Distribution Analysis
Can we see the smallest 2 x 2 target? Mottle is a function of viewing distance. The digital image can contain patterns that are sub-visible as well those that are visible at normal viewing distance and those that are apparent only at a long distance. • Sub-visible • Normal -Visible • Macro Verity IA - Stochastic Frequency Distribution Analysis
Normal Visible Sub-Visible Macro Pattern Number for the FULL range of tile sizes that will fit in a typical digital image. Pattern Number Calculation Verity IA - Stochastic Frequency Distribution Analysis
Why disagreement with visual perception? The human eye can visibly inspect a large image at various viewing distances and recognize a pattern. To do this we examine the frequency of luminance changes in all directions and form opinions as to their severity, spatial distribution, and physical size of recognizable objects. The viewing distance directly influences our ability to identify some patterns. One cannot see the detail at 1 meter that one can see at 50 cm. But one can see at 50 cm all the detail that is visible at 1 meter. It is difficult for most viewers to compare one large area to another one unless they are contiguous. In monochromatic images the human eye cannot see luminance variations as well as the sensors in the scanner’s camera. The SFDA algorithm is sensitive to the three dimensional variations in the spatial distribution. Verity IA - Stochastic Frequency Distribution Analysis
Color Band (Channel) Analysis Verity IA - Stochastic Frequency Distribution Analysis
Color – Digital Image - Basic component blends The Variation Source - Diagnostics Blue Magenta Cyan White BlacK Red Yellow Green Verity IA - Stochastic Frequency Distribution Analysis
Diagnostics - CMY Extraction Camera and Scanner CCD array of sensors produce an RGB image. • Individually examine the effects of Cyan, Magenta, and Yellow Ink as: • Reflected Components • Absorbed Components Reflected Absorbed Verity IA - Stochastic Frequency Distribution Analysis
Color Band Extracted (Absorbed by:) Average of All Mottle: 34.87 Color Band Extracted (Absorbed by:) Red (Cyan) Mottle: 54.18 Average of All Mottle: 19.15 Green (Magenta) Mottle: 50.69 Blue (Yellow) Mottle: 74.04 Red (Cyan) Mottle: 44.25 Green (Magenta) Mottle: 29.31 Blue (Yellow) Mottle: 39.63 Specimen #1 from Test 1 Specimen #1 from Test 2 Images enhanced: Interpolation = 12, Brightness gain = 85. Verity IA - Stochastic Frequency Distribution Analysis
Pattern Measurement Theory Stochastic Frequency Distribution Analysis Created by Roy R. Rosenberger, Verity IA LLC royr@verityia.com Verity IA - Stochastic Frequency Distribution Analysis
IGT A5 Wet Trap Test An application of the method Verity IA - Stochastic Frequency Distribution Analysis
Step 1 - 1st Print Head Print Area Step 2 - 2nd Print Head - No Delay Wet Trap - IGT A5 Wet Trap Test Description – No Time Delay The IGT A5 has two print heads. Each applies ink to the same print test strip in different but overlapping positions. The interval between each head application can be precisely controlled. No Time Delay Wet Trap. First print head stops at ¾ point and with no time delay the second head starts at ¼ point. The second head finishes at full length while the first stops at the ¾ point. IGT Printed Paper Test Strip Verity IA - Stochastic Frequency Distribution Analysis
Step 1 - 1st Print Head Print Area Step 3 –A 2nd Print Head - Time Delay Wet Trap - Step 3 -B 1st Head Restarted with 2nd Head - No Delay Wet Trap - IGT A5 Wet Trap Test Description –Time Delay The IGT A5 has two print heads. Each applies ink to the same print test strip in different but overlapping positions. The interval between each head application can be precisely controlled. Step 2 - Time Delay (Example: 6 Seconds) Time Delay wet trap vs. No Delay Wet Trap. Print with time delay causes first print head to stop at mid-point and after a time delay the second head starts at ¼ point at the same time as the first head begins again at the mid-point. The second head finishes at full length while the first stops at ¾. IGT Printed Paper Test Strip Verity IA - Stochastic Frequency Distribution Analysis
IGT A5 Wet Trap Test Description –Time Delay Run a series of different time delays on a single paper specimen. Arrange the test strips to for visual inspection and to acquire a digital image of the time delay areas. Inspect and then acquire the digital image in full RGB color 9 Sec. Delay 6 Sec. Delay 3 Sec. Delay Example A5 Strip No Delay Verity IA - Stochastic Frequency Distribution Analysis
IGT A5 Wet Trap Test Description –Time DelayVisual Inspection Time delay over-print test run on same paper specimen at four (4) different time delays between first print and second print (over-print). Three inspectors visually ranked results: 9 Sec. Delay 6 Sec. Delay 3 Sec. Delay No Delay Verity IA - Stochastic Frequency Distribution Analysis
IGT A5 Wet Trap Test Description –Time Delay The inspectors do not agree on the rank of the two worst. 9 Sec. Delay 6 Sec. Delay All inspectors agree that 6 & 9 are the worst. 3 Sec. Delay No Delay Verity IA - Stochastic Frequency Distribution Analysis
Mean: 95.8 Mode: 95 Mottle = 27.4 40 30 New Mottle # 20 Mean: 97.3 Mode: 97 10 Mottle = 33.5 Time delay –seconds 0 3 6 9 105 The pixel luminance value statistical mode* for the 9 second is greater thanthe 6 second, thus more ink was transferred and it is possible the mottle level IS higher. * most populous luminance value Mean Luminance 100 95 Mean: 92.9 Mode: 92 90 Time delay –seconds 0 3 6 9 Mottle = 19.6 Mean: 102.4 Mode: 103 Mottle = 13.3 Wet Trap – Variable time delay 9 Sec. Delay 6 Sec. Delay 3 Sec. Delay IGT A5 at RIT, Wet Trap Analysis: Overprinted sections of printed strips scanned as single image at 300 ppi No Delay Verity IA - Stochastic Frequency Distribution Analysis
Mottle = 27.4 Mottle = 33.5 Mottle = 19.6 Mottle = 13.3 Wet Trap – Variable time delay 9 Sec. Delay 6 Sec. Delay 3 Sec. Delay IGT A5 at RIT, Wet Trap Analysis: Overprinted sections of printed strips scanned as single image at 300 ppi No Delay Verity IA - Stochastic Frequency Distribution Analysis
A typical mottle digital image example from a Back Trap / Water Interference Test The new mottle measurement is used in the measurement ofback trap / water interference measurement at RIT. 2nd unit Cyan 6th unit Cyan The image was acquired at 300 ppi and is 200 mm x 200 mm. Zooming shows the individual pixels that make up the image. For effective mottle measurement the digital image must be large enough and have only enough resolution to visibly demonstrate the mottle to be measured. Side by sideimages of the 2nd unit and 6th unit cyan offset print made at the Rochester Institute of Technology, Rochester, NY. Verity IA - Stochastic Frequency Distribution Analysis
Original RGB image 2nd unit Cyan 6th unit Cyan RGB Band split Cyan extraction Convert result to gray scale image The process begins with a CMY extraction 2nd unit Cyan 6th unit Cyan Digital resolution need only be sufficient to visually replicate the mottle. As will be demonstrated, 300 ppi has been found to be good working resolution. 300 ppi, RGB, side by sideimages of the 2nd unit and 6th unit cyan offset print made at the Rochester Institute of Technology, Rochester, NY. Verity IA - Stochastic Frequency Distribution Analysis
Diagnostics - CMY Extraction • Example: • Produce a solid blue by: • Print Solid Cyan • Overprint with Magenta • Acquire full color (RGB) digital image of blue area • Split digital image into individual RGB color images • Recombine reflected components • Green + Blue = Cyan • Red + Blue = Magenta = + Verity IA - Stochastic Frequency Distribution Analysis
The image tile concept: ISO 13660 5.2.3.1 & 5.2.4 Minimum Rectangular Inspection Area >= 161 mm2 with a minimum Height and Width >= 12.7 mm and divided into (n) >= 100 non-overlapping square tiles Each tile >= 1.61 mm2 with Height and Width >= 1.27 mm 600 spi H x W = 30 x 30: 300 spi H x W = 15 x 15 1.27 mm 1.27 mm For each tile, compute the average (M) pixel luminance value (LV) of the pixels within it: n = Total number of tiles M 1 to n = Average Pixel Luminance Value(0 to 255) ISO 13660 Mottle = s ( M 1 to n ) [Standard deviation of the average pixel luminance values within each tile] Verity IA - Stochastic Frequency Distribution Analysis
Before Clipping 10.8 mm tile Best : Mottle = 16.4 Best : Mottle = 19.2 Worst: Mottle = 21.5 Worst: Mottle = 25.5 After Clipping 10.8 mm tile Mottle Measurement Set-up Tile Size Range The measurement is sensitized for the conditions in this test series Verity IA - Stochastic Frequency Distribution Analysis
The physical dimensions of the tiles in each layer determine if the tile is visible. Typical tile dimensions at various resolutions: Spatial Distribution – Sub-Visible vs. Visible Tiles This method is based entirely upon the digital image resolution, calibration, spi, ppi. When applied to its full range, the first tile is 2 pixels x 2 pixels regardless of resolution. The division between visible and sub-visible tile dimensions is arbitrarily set at about 0.2 mm x 0.2 mm. On close inspection the eye can perceive a high contrast change in shade within this small square. The method allows the division between visible and sub-visible to be selected. Verity IA - Stochastic Frequency Distribution Analysis
300 spi (ppi) image with a selected area of the 2nd unit cyan, 85 mm x 195 mm The full range of tile sizes applied to the 2nd unit cyan. Mottle numbers for each tile size. The tile size range that fits inside the selected area within the image Full Tile Size Range - Mottle – Cyan 2nd unit Full Range Average Mottle = 62.3 2nd unit Cyan 6th unit Cyan Verity IA - Stochastic Frequency Distribution Analysis
300 spi (ppi) image with a selected area of the 2nd unit cyan, 85 mm x 195 mm The full range of tile sizes applied to the 2nd unit cyan. Sub-Visible Mottle numbers for each tile size. Sub-Visible The tile size range that fits inside the selected area within the image Application – Full Range Mottle – Cyan 2nd unit Full Range Average Mottle = 62.3 2nd unit Cyan 6th unit Cyan Verity IA - Stochastic Frequency Distribution Analysis
Does the largest tile sense mottle? Clipping the upper layers to constrain the measurement to sensitize measurement. Verity IA - Stochastic Frequency Distribution Analysis
The largest tile makes no contribution to mottle measurement in this image. It could be eliminated from the mottle calculation to make it more responsive. 300 spi (ppi) image with a selected area of the 2nd unit cyan, 85 mm x 195 mm Mottle numbers for each tile size. Visible range of tile sizes applied to the 2nd unit cyan The tile size range that fits inside the selected area within the image Application – Visible Range Mottle – Cyan 2nd unit Visible Range Average Mottle = 16.2 Eliminating 21.7 mm tile: Mottle = 19.3 Verity IA - Stochastic Frequency Distribution Analysis