Download
1 / 36
360 likes | 382 Views
This report presents figures and projections on the shares of renewable energy, gross energy consumption, final energy consumption, electricity consumption, energy intensity, household heating, industry and services consumption, transport sector consumption, electricity and district heating sector consumption, and emissions of greenhouse gases in Denmark from 2017 to 2030.

E N D
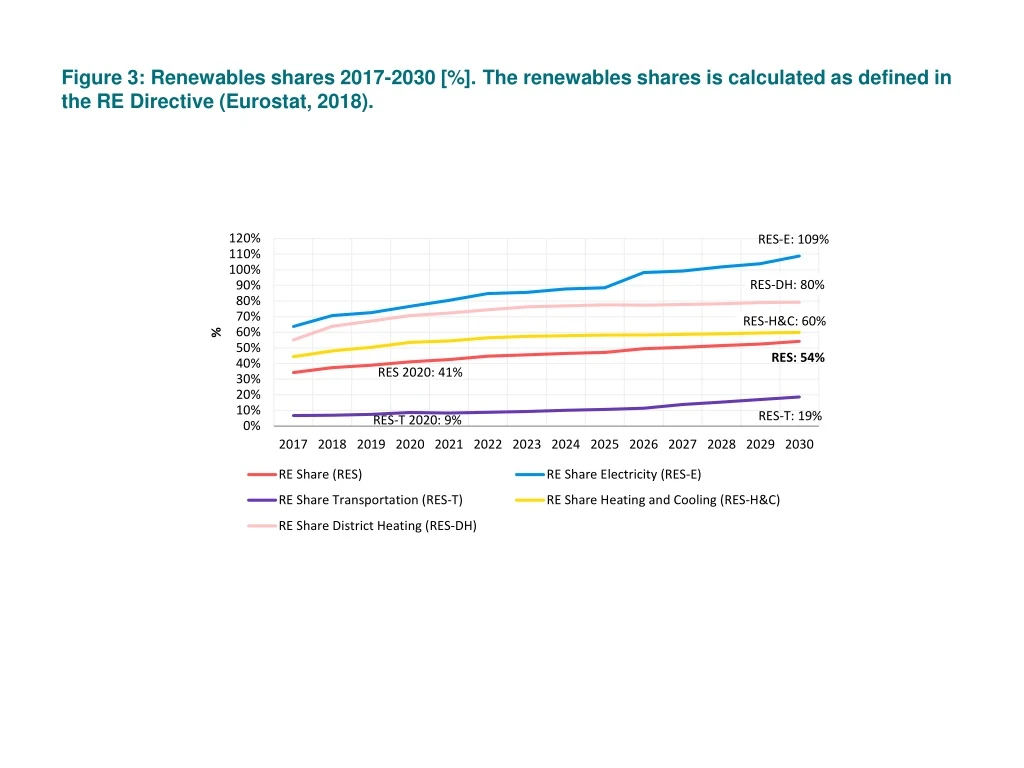
Figure 3: Renewables shares 2017-2030 [%]. The renewables shares is calculated as defined in the RE Directive (Eurostat, 2018).
Figure 4: Gross energy consumption by type of energy 1990-2030 [PJ]. The calculation for 1990-2017 has been adjusted for outdoor temperature/degree days relative to normal years (climate-adjusted) and electricity trade with other countries (electricity-trade adjusted, see Appendix 2).
Figure 5: Final energy consumption by consumption sector 1990-2030 [PJ].
Figure 6: Electricity consumption (excluding grid losses) by use 2017-2030 [PJ].
Figure 7: Electricity consumption (excluding grid losses) by use in 2030 [%].
Figure 8: Macro-economic energy intensity measured in relation to gross energy consumption and final energy consumption 2017-2030 [TJ per DKK mill.].
Figure 9: Final energy consumption by households for heating 2017-2030 [PJ]. Gas comprises mains gas, i.e. natural gas, gas works gas and bio-natural gas. Other renewable energy includes firewood in particular, but also solar heating and straw.
Figure 10: Final energy consumption by households analysed by selected heating technologies 2017-2030 [PJ]. Energy consumption by heat pumps includes ambient heat and electricity consumption. Gas comprises natural gas, gas works gas and bio-natural gas. District heating and fuel wood have been excluded.
Figure 11: Number of electrical appliances [Index] and developments in electricity consumption by use: electronic equipment, electrical appliances and lighting 2017-2030 [TWh].
Figure 12: Final energy consumption by industry and services by type of energy 2017-2030 [PJ].
Figure 13: Final consumption of fossil fuels by industry and services by sector 2017-2030 [PJ].
Figure 14: Industry and services’ consumption of different types of energy by use in 2030 [PJ] and share of fossil fuels [%]. Coal includes coal, coke, petroleum coke and fossil waste. Gas comprises mains gas that includes both natural gas and bio-natural gas. The fossil share does not include fossil fuels used for electricity and district heating production.
Figure 15: Industry and services energy consumption for heat pumps [PJ].
Figure 16: Energy intensity in industry and services by industry 2017-2030 [PJ/DKK bn.].
Figure 17: Final energy consumption by the transport sector by use 2017-2030 [PJ].
Figure 18: Electricity consumption by the transport sector by area of use 2017-2030 [PJ].
Figure 19: Electrified vehicles' share of sales of new vehicles and share of total number of passenger cars and vans on the road 2017-2030 [%].
Figure 20: Renewable energy consumption by the transport sector 2017-2030 [PJ ].
Figure 21: Location of coal-fired electricity production plants and offshore wind turbines.
Figure 22: Consumption of energy by the electricity and district heating sector, by type of energy 2017-2030 [PJ].
Figure 23: Renewables share in electricity consumption (RES-E) by wind power, solar PV, bioenergy and hydropower 2017-2030 [%]. Hydropower is very small and has been included in solar PV.
Figure 24: Electricity consumption, including transmission and distribution losses, electricity production and electricity imports 2017-2030 (TWh).
Figure 25: Electricity spot market prices for Denmark and selected price-setting markets 2017-2030 [2019 DKK/MWh]. Prices for all the years are model results. The Danish Energy Agency uses statistical prices and forward prices for 2017-2020. NO: Norway, SE: Sweden, FI: Finland, DE-AT-LU: Germany, Austria, Luxembourg, NL: The Netherlands, GB: Great Britain, FR-BE: Belgium, DK: Denmark.
Figure 26: Availability of coal plants in the projection 2017-2030. Light grey shows that operation of the relevant plant is expected to be limited in the relevant period.
Figure 27: Small-scale electricity production capacity (>0) and electricity consumption capacity for heat production (<0) in small and medium-sized urban areas 2017-2030 [MW electricity].
Figure 28: Consumption of fossil fuels in the electricity and district heating sector 2017-2030 [PJ].
Figure 29: Domestic electricity production by type of production, and share of electricity imports in total electricity production [%].
Figure 30: District heating production by type of energy and renewables share in district heating 2017-2030 [PJ]. Heat pumps cover production from ambient heat and surplus heat. Surplus heat is without use of heat pumps.
Figure 31: Consumption of mains gas broken down by natural gas and bio-natural gas 2017-2030 [PJ], and the share of bio-natural gas in mains gas [%]. The calculation is based on bio-natural gas produced in relation to the domestic consumption of mains gas.
Figure 32: Emissions of greenhouse gases by sector from 1990-2030 and in the 1990 UN base year [mill. tonnes CO2-eq.]. The statistical calculation of the area chart for 1990-2017 has been adjusted for electricity trade with other countries (electricity-trade adjusted (Appendix 2)). Reduction targets are based on observed (actual) emissions relative to the UN base year and excluding LULUCF. LULUCF emissions are calculated separately and are not included here.
Figure 33: Non-ETS emissions 2005-2020 and reduction commitment 2013-2020 [mill. tonnes CO2-eq.]
Figure 34: Non-ETS emissions 2005-2030, reduction commitment and accumulated shortfall 2021-2030 [mill. tonnes CO2-eq.].
Figure 35: LULUCF emissions and sinks 1990-2030 [mill. tonnes CO2-eq.]
Figure 36: CO2 emissions from industry and services in 2030 by energy service and type of fuel [mill. tonnes CO2].
Figure 37: Difference between central scenario and partial sensitivities in the total share of renewables (RES). Red bars show reduced renewables shares; green bars show increased renewables shares.
Figure 38: Difference between central scenario and partial sensitivities in emissions broken down by ETS and non-ETS [mill. tonnes CO2-eq.]. Green bars show reduced emissions; red bars show increased emissions.


