Download
1 / 1
10 likes | 100 Views
Applying Vertical Radial Plume Mapping to Estimate Emission Rate in Petro Chemical Industry.

E N D
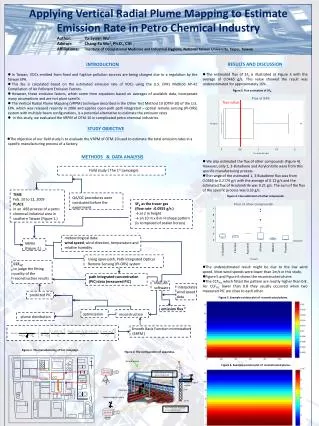
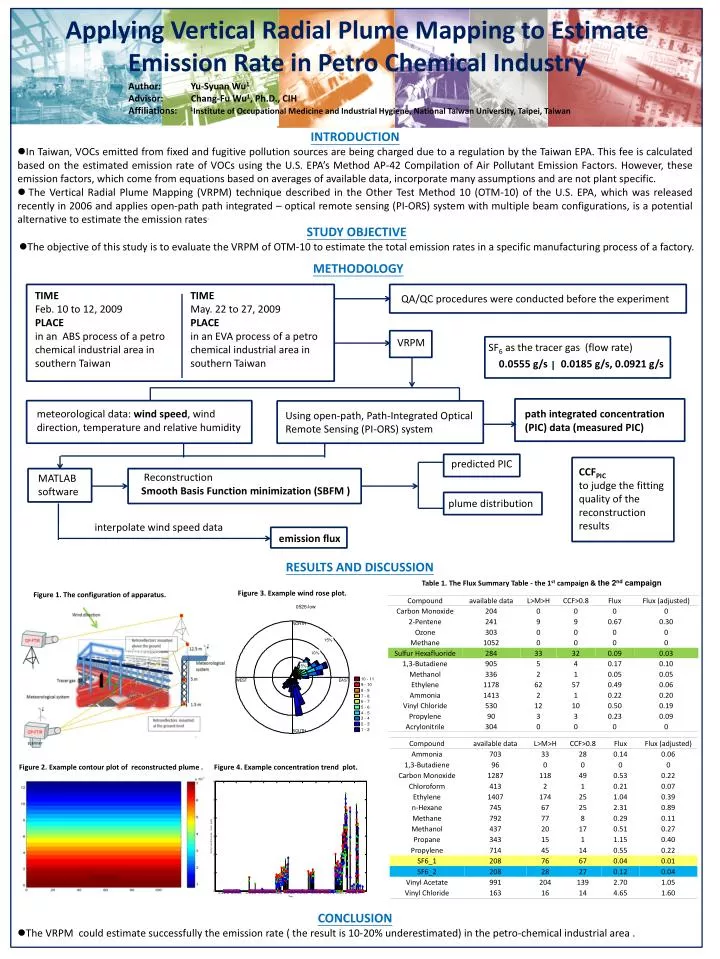
Applying Vertical Radial Plume Mapping to Estimate Emission Rate in Petro Chemical Industry Author: Yu-Syuan Wu1 Advisor: Chang-Fu Wu1, Ph.D., CIHAffiliations: 1Institute of Occupational Medicine and Industrial Hygiene, National Taiwan University, Taipei, Taiwan • INTRODUCTION • In Taiwan, VOCs emitted from fixed and fugitive pollution sources are being charged due to a regulation by the Taiwan EPA. This fee is calculated based on the estimated emission rate of VOCs using the U.S. EPA’s Method AP-42 Compilation of Air Pollutant Emission Factors. However, these emission factors, which come from equations based on averages of available data, incorporate many assumptions and are not plant specific. • The Vertical Radial Plume Mapping (VRPM) technique described in the Other Test Method 10 (OTM-10) of the U.S. EPA, which was released recently in 2006 and applies open-path path integrated – optical remote sensing (PI-ORS) system with multiple beam configurations, is a potential alternative to estimate the emission rates. • STUDY OBJECTIVE • The objective of this study is to evaluate the VRPM of OTM-10 to estimate the total emission rates in a specific manufacturing process of a factory. METHODOLOGY SF6 as the tracer gas (flow rate) 0.0555 g/s 0.0185 g/s, 0.0921 g/s TIME Feb. 10 to 12, 2009 PLACE in an ABS process of a petro chemical industrial area in southern Taiwan TIME May. 22 to 27, 2009 PLACE in an EVA process of a petro chemical industrial area in southern Taiwan QA/QC procedures were conducted before the experiment meteorological data: wind speed, wind direction, temperature and relative humidity path integrated concentration (PIC) data (measured PIC) VRPM Reconstruction Smooth Basis Function minimization (SBFM ) MATLABsoftware Using open-path, Path-Integrated Optical Remote Sensing (PI-ORS) system RESULTS AND DISCUSSION Table 1. The Flux Summary Table - the 1st campaign & the 2nd campaign CCFPIC to judge the fitting quality of the reconstruction results interpolate wind speed data Figure 3. Example wind rose plot. predicted PIC Figure 1. The configuration of apparatus. emission flux plume distribution Figure 2. Example contour plot of reconstructed plume . Figure 4. Example concentration trend plot. • CONCLUSION • The VRPM could estimate successfully the emission rate ( the result is 10-20% underestimated) in the petro-chemical industrial area .